There’s a difference between what maps show and what actually exists in the real world. While humans can adjust to missing data, new (software-) map users, from AVs to driver assist functions (such as Intelligent Speed Assist), cannot. While some map layers, such as the base map, seldom change, additional map layers, such as road furniture (e.g. traffic signs), or lane information change more often. To ensure safety for AV applications, the data in all relevant map layers should be highly accurate, with any change quickly detected and updated on the map.
Introduction
As the real world around us changes, maps are predestined to become stale. AVs need to understand the road, and need to become “aware” of any change on the road. Maps will need to reflect change so they can stay accurate, showing everything on the road from work zones to lane markings and road signs, such as speed limits. While others have checked OSM’s applicability for rideshare, we wanted to look at its applicability to speed limit data, which is of special importance to the future of self-driving. Speed limits aren’t very dynamic, certainly less so than work zones which can change daily or hourly - but they do change. By collecting crowdsourced data from our vision network and comparing it to OSM data and to City of Phoenix known road speed limits, we wanted to check the accuracy of speed limit data and its rate of change. Understanding the accuracy of both city-sourced data and OSM against the ground truth represents the rate of real-world change (or map error data) and how it impacts the accuracy of maps and their usability for autonomous driving. It also presents a roadmap for the future use of crowd sourced data to create better maps.
Printed-on-paper maps are destined to become stale at the exact moment of their publication, since the ground truth always changes. Mapping giants invest endless resources to update maps in an expensive and laborious process. Continuous coverage is not a viable option for traditional mapping since they either use expensive vehicles for mapping or rely on reports of change; if the
data changes (a speed limit was decreased/increased) or is transient (a work zone) it likely won’t get picked up automatically. Since map elements don’t contain a time stamp it’s difficult to know whether they are accurate or not. Historically, humans used maps mainly to navigate; they wanted them to tell them how to get somewhere, not to understand road rules. Yet, increasingly, maps are not only used by humans, but also by software. AVs and other automated driving scenarios (Intelligent Speed Assist, for instance) need a different kind of map - a map that is detailed, at lane level or better, with a high degree of accuracy, and that reflects transient changes on the road. Autonomous Vehicles need maps that are precise and contain fresh data, at scale. Humans do not refer to posted speed limits on a map while driving, but software does. This means that the question of how much change happens in maps, and who uses it (software) is about to change how we think about maps and their freshness and accuracy. In general, one can identify 4 layers in maps that
AVs and driver assist apps will require: → Basemap → Lane semantics → Road furniture → Dynamic location-based services

Collecting ground truth fresh data fromcrowd-sourced vision
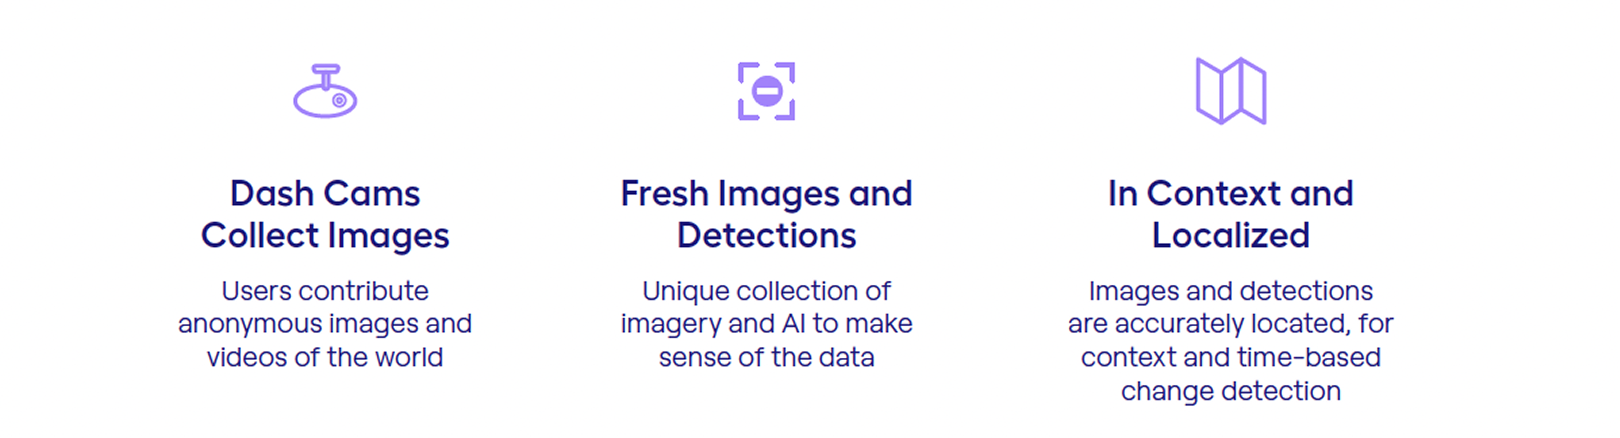
Nexar utilizes a network of smart dash cams to collect vision at scale, using low-cost cameras. Using AI (on-device and on the cloud), detections of road elements are made, and this detection data is aggregated and localized, providing a real time (map-agnostic) layer, of transient (such as work zones) or static road elements, on top of an existing map. Nexar dash cams pay frequent visits to a given area, creating continuous coverage and fresh detections of ground truth changes to the road - while keeping economics feasible. When maps are updated using crowd sourced data, freshness of detections is what determines the accuracy of maps, since this approach continuously detects change and maps it, applying a virtual timestamp on any element on a map, noting when was it last monitored for change. Here’s a diagram explaining crowd-sourced vision at a very high level:
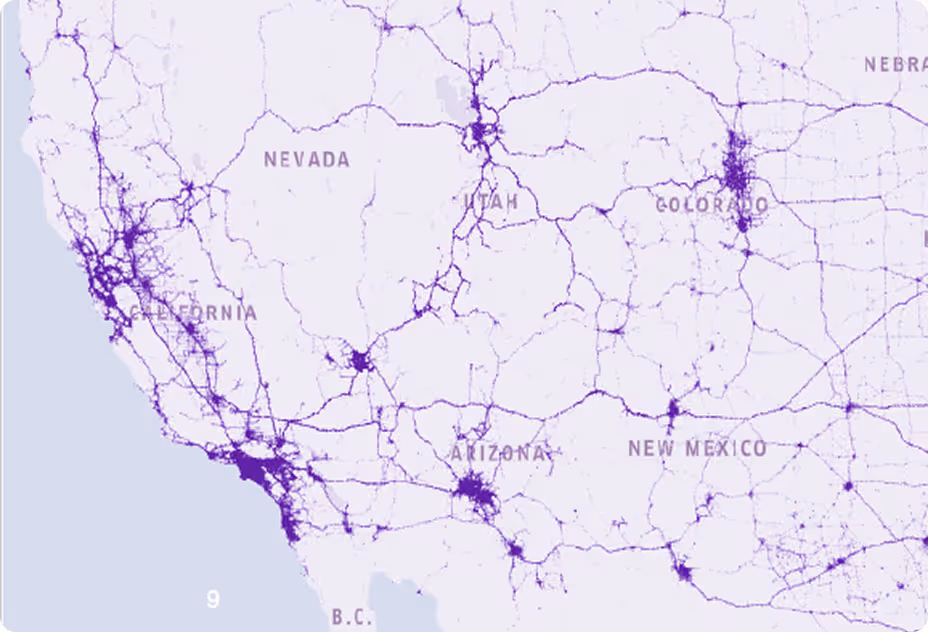
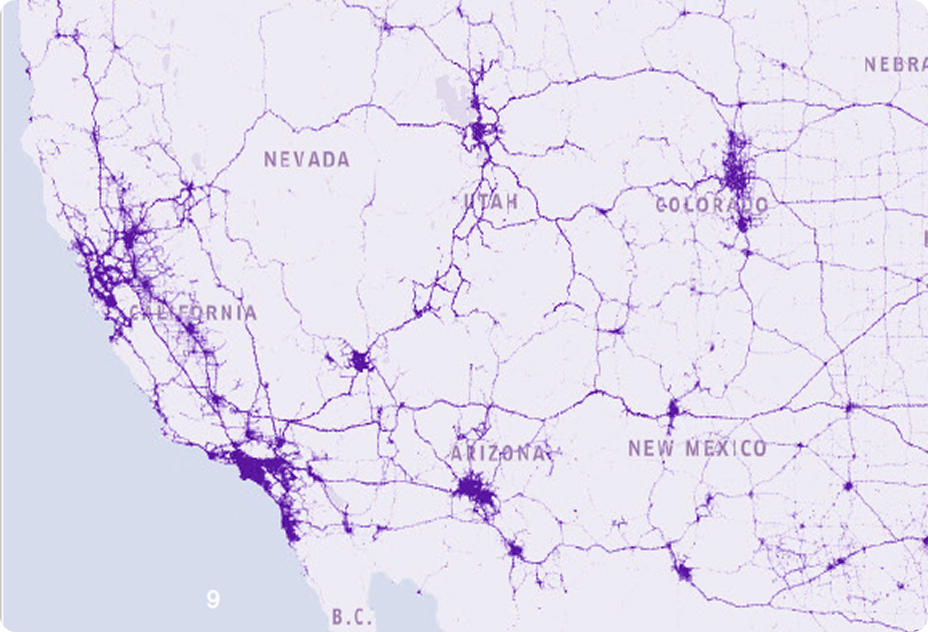
To show crowd-sourced vision in action and the changes it detects, let’s take a look at Phoenix. We will compare Nexar’sapproach to road inventory detection (focusing on street signs) with existing data about Phoenix.

Methodology: How many speed limit signs can Nexar “see” in Phoenix, AZ?
While there have been reports on the accuracy of the OpenStreetMap, its freshness with regards to various road elements, stop signs and speed limit signs wasn’t checked (to the best of our knowledge). In late 2021, we released our analysis of crowd-sourced stop sign detections in Seattle, comparing OSM to Nexar data. This report will present our analysis of road speed limits vs ground truth in Phoenix, AZ, the fifth largest city in the US and a hotbed of AV trials. Speed limit detection is interesting for a variety of reasons. It is required for Intelligent Speed Assist applications (which also require additional capabilities of determining permitted speed where there is no posted speed limit sign, a subject we won’t touch on in this report) and for AVs to better understand the road.
While there have been reports on the accuracy of the OpenStreetMap, its freshness with regards to various road elements, stop signs and speed limit signs wasn’t checked (to the best of our knowledge). In late 2021, we released our analysis of crowd-sourced stop sign detections in Seattle, comparing OSM to Nexar data. This report will present our analysis of road speed limits vs ground truth in Phoenix, AZ, the fifth largest city in the US and a hotbed of AV trials. Speed limit detection is interesting for a variety of reasons. It is required for Intelligent Speed Assist applications (which also require additional capabilities of determining permitted speed where there is no posted speed limit sign, a subject we won’t touch on in this report) and for AVs to better understand the road.
How well does OSM account for speed limit signs in Phoenix, AZ?
First, we collected Nexar speed limit sign detections made during October 2021, in the area appearing below. What’s interesting is that we collected detections just during one month, using our existing dash cam network. Using Nexar’s network of connected AI powered dash cams and dedicated data pipeline, we curated an MUTCD_ R2_1 compliant data set of 3,562 max speed limits in Phoenix. We focused on the five speed limit signs (30, 35, 40, 45 and 50 Mph). To validate our dataset, we ran our aggregation pipeline including human-in-the-loop editorial feedback, in order to ensure maximum available recall of signs with 100% provided detection precision. To verify that we did not miss any signs, we annotated 5,450 random frames where no speed limits signs were detected from an evenly distributed sample across different road types, also comparing the frames to Google StreetView images of the relevant areas. In this test, we found that of the 5,450 frames, we had missed just one speed limit sign, giving us a 99.98% true negative rate. Since Nexar detects signs from frames, and to associate frames with road segments, we snapped each frame from a ride to a specific road segment using a map-matching utility that uses the trace or trajectory of the ride to understand which road segment the car drove on. As part of our aggregation pipeline, we snapped each frame to
a specific OSM segment. This allowed us to compare our detections with the metadata information on OSM. In this way we could validate our detected road signs with OSM speed limits. First, we tested how well frames were snapped to OSM road segments using the gps trace of the ride up to the detection. For this purpose we annotated how many detections out of the same randomly chosen 5,450 frames were snapped to the correct road by comparing the snapped frame location with Google Street View of the same reported location. 94% of frames were snapped correctly. For the same bounding box, we pulled OSM ways (a total of 13,579) that contain information about the maximum speed limit. We then compared them to Nexar detections, with the results appearing below.

Want to dive deeper?
Nexar helps industry leaders turn vision into value. Dive into real-world success stories where our data redefined the road ahead - and see what it can do for you.