Every city talks about mobility. Nexar shows you how fast it actually moves. This heat map visualizes the velocity of our network: how often our cameras re-see every block, every corridor, every hotspot. No model, no guesswork. Just raw, constantly refreshing ground truth
The displayed video is for illustrative purposes only* *MTBV stands for average time between visits in minutes, in which we can clearly see how dense populated zones are updated frequently, while sparse and unpopulated zones are updated over a longer period
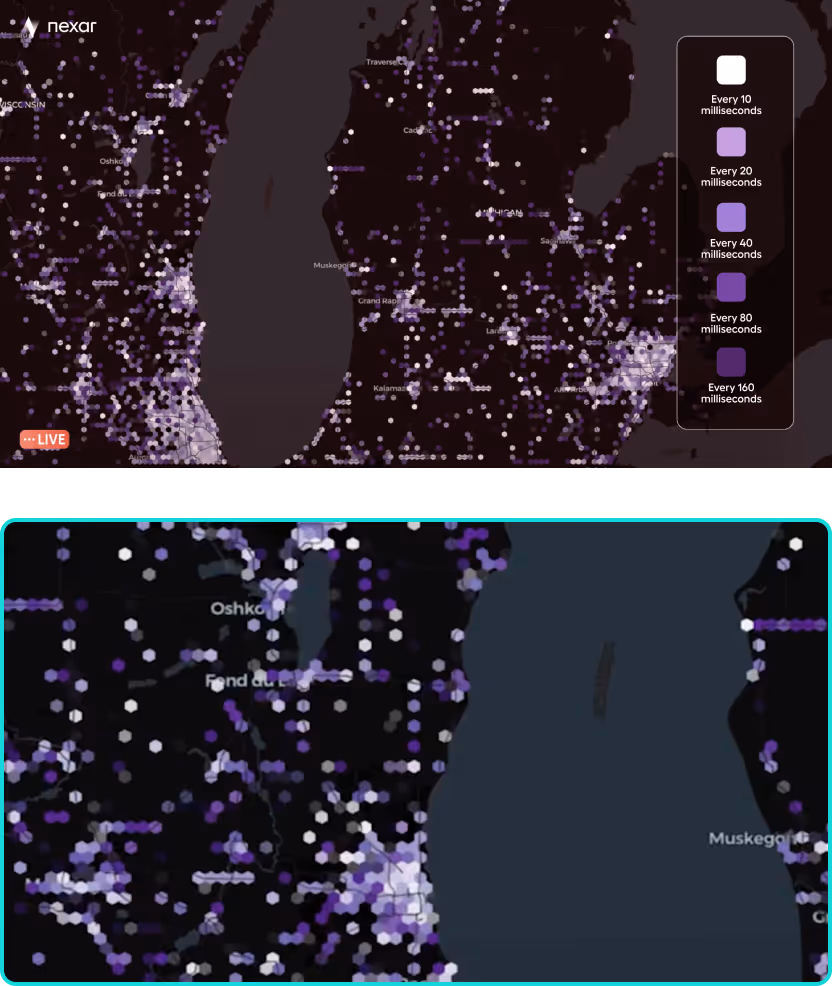
Watch a City Breathe in Real Time
What you’re seeing is a rolling snapshot of how quickly Nexar refreshes the urban world. Higher-frequency zones light up first. Lower-frequency areas follow. Together, they prove one simple fact: coverage isn’t a claim. It’s a cadence
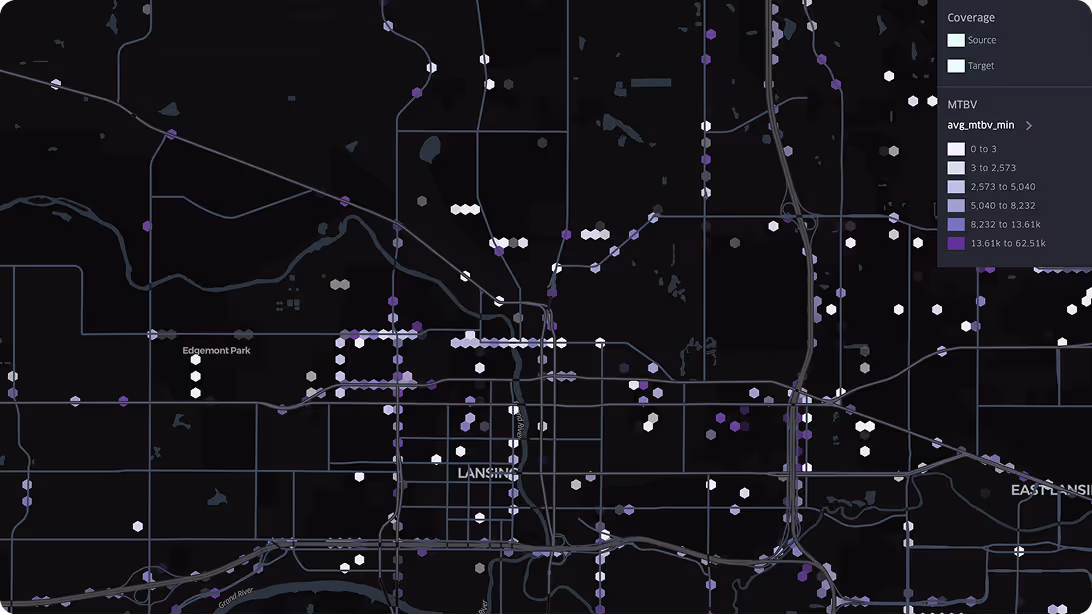
Cities change faster than most maps can keep up.
Cones shift, lanes move, and traffic patterns rewrite themselves by the hour.
Relying on static data means working off a version of the city that no longer exists.
Nexar keeps the truth fresh by continuously re-seeing the roads as they actually are.
The Network Behind the Heat Map
Nexar’s refresh rate isn’t marketing language. It’s the product of a uniquely dense, real-world driving network that sees cities continuously at street level.
350K+
Active users
That compose the base of our network
1.2 Billion+
Miles Annually
Sourced from our network
4
Rides starting each second
Expanding and collecting new information constantly
Why Refresh Speed Changes Everything
And How It Is Relevant For You
Fresh data exposes lane shifts, work zones, and routing hazards the moment they appear.
Historical patterns reveal how corridors behave hour by hour, not just season to season.
Cross-referenced together, they turn a living map into a planning tool you can actually trust.