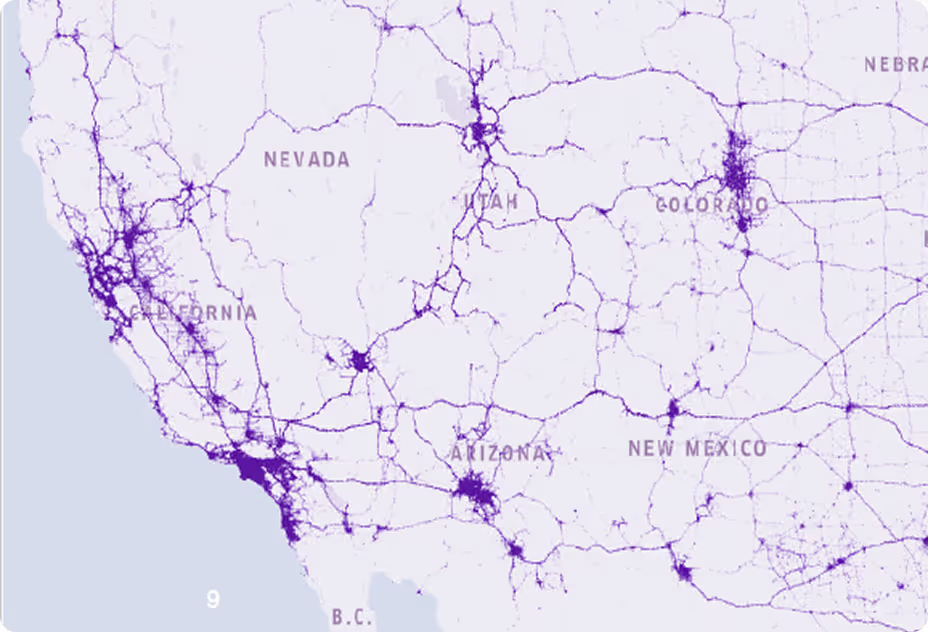
The next Blue Moon rises on Sunday, May 31, 2026 — only the third since 2021. Drawing on Nexar’s May 2025 fleet baseline and peer-reviewed traffic-safety literature, this study models a “watch-for” narrative — a ceiling scenario consistent with external research, not a verified forecast.
Executive Summary
▲ CRITICAL CONTEXT — READ FIRST May 31, 2026 is in the future. This is a forward-looking scenario analysis, not a prediction. The study applies findings from peer-reviewed full-moon traffic research to Nexar’s observed May 2025 fleet baselines to construct a “here’s what the data suggests to watch for” narrative.
All projections are presented as scenarios consistent with external literature — not verified forecasts. The most likely outcome on May 31 is indistinguishable from a typical non-holiday Sunday.
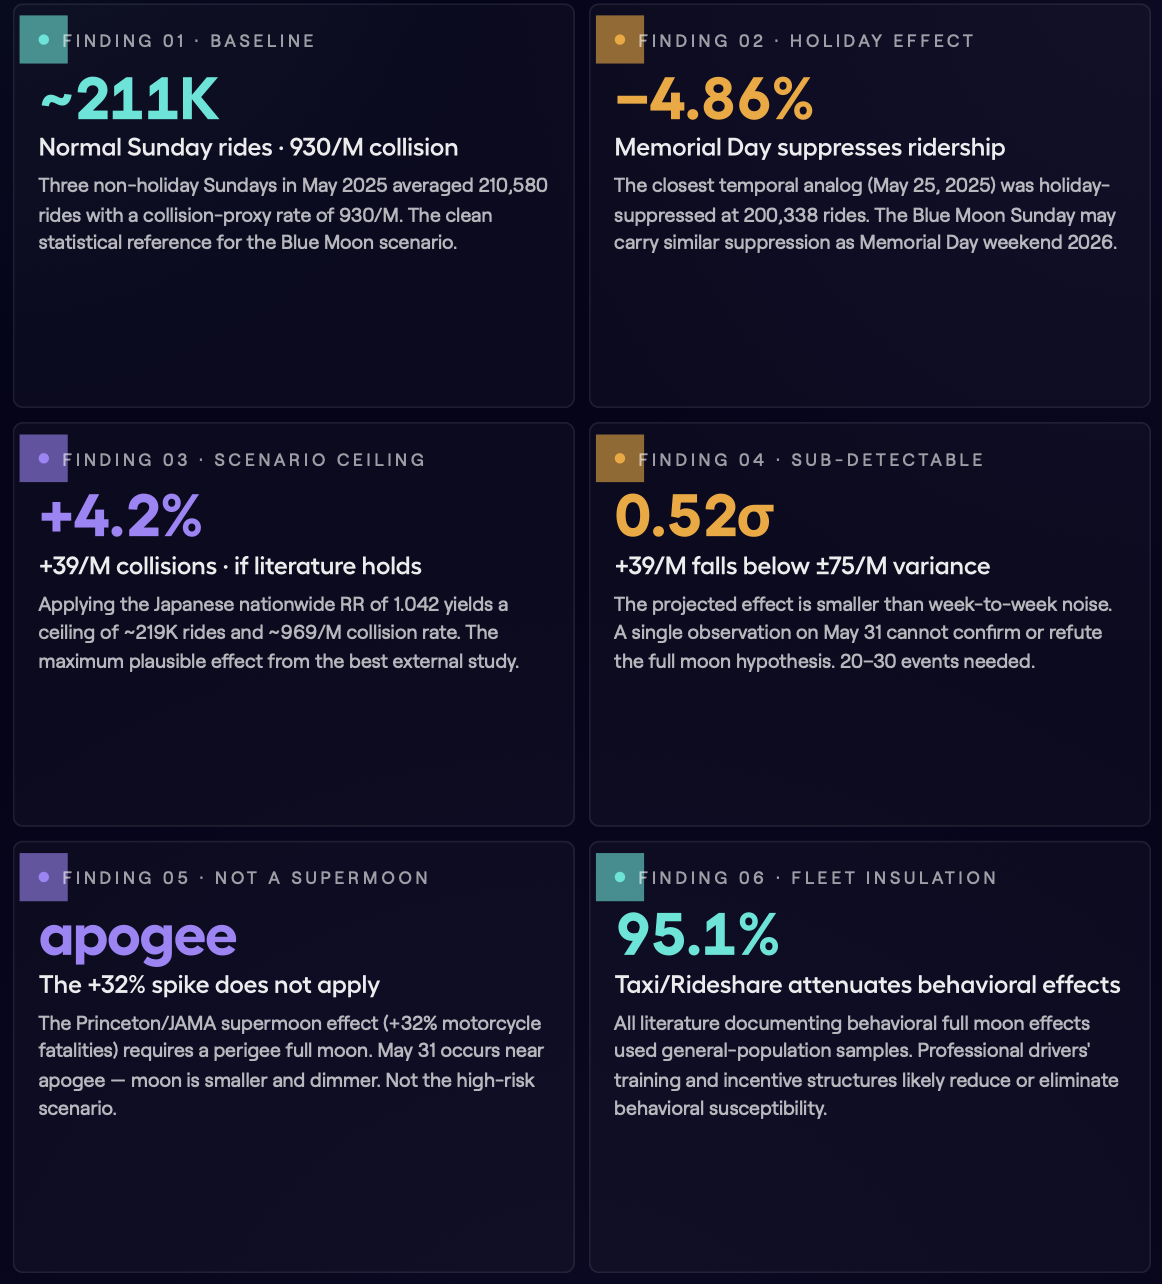
◆ NOT A SUPERMOON: The May 31, 2026 Blue Moon occurs near lunar apogee — the farthest point in the Moon’s orbit — making it smaller and dimmer than average. The +32% motorcycle-crash spike documented in the Princeton/JAMA supermoon literature explicitly does not apply here.
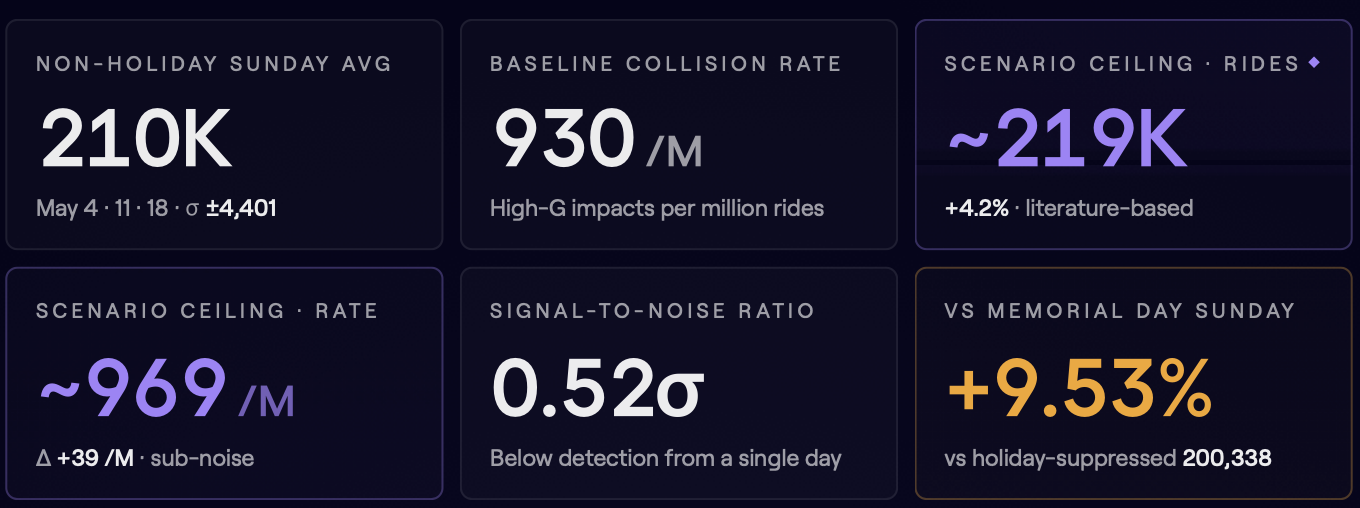
On May 31, 2026, a Blue Moon will rise over the United States — the second full moon in May 2026 and only the third Blue Moon since 2021. The prior Sunday baseline from Nexar’s May 2025 fleet data shows approximately 210,580 rides on a normal non-holiday Sunday, with a baseline collision-proxy rate of 930 high-G impact events per million rides.
Headline Scenario · Not a Prediction
Applying the most defensible estimate from the literature — Tanaka et al. (2018) nationwide RR of 1.042 — yields a ceiling of approximately 219,424 rides and a collision-proxy rate of ~969 per million on May 31. The absolute increase of +39 events per million falls below the observed week-to-week variance of ±75 per million — a signal below noise.
◆ THE BOTTOM LINE: This Blue Moon is not a supermoon — it occurs near lunar apogee, making it smaller and dimmer than average. The dramatic +32% motorcycle crash spike documented in the Princeton/JAMA supermoon literature does not apply here. The relevant scenario is the modest 4–5% general-full-moon effect, if real, driven primarily by light effects and potential behavioral distraction — not anything mystical. The professional-fleet context (95% Taxi/Rideshare) may further attenuate behavioral effects documented in studies of general-population drivers.
Key Metrics
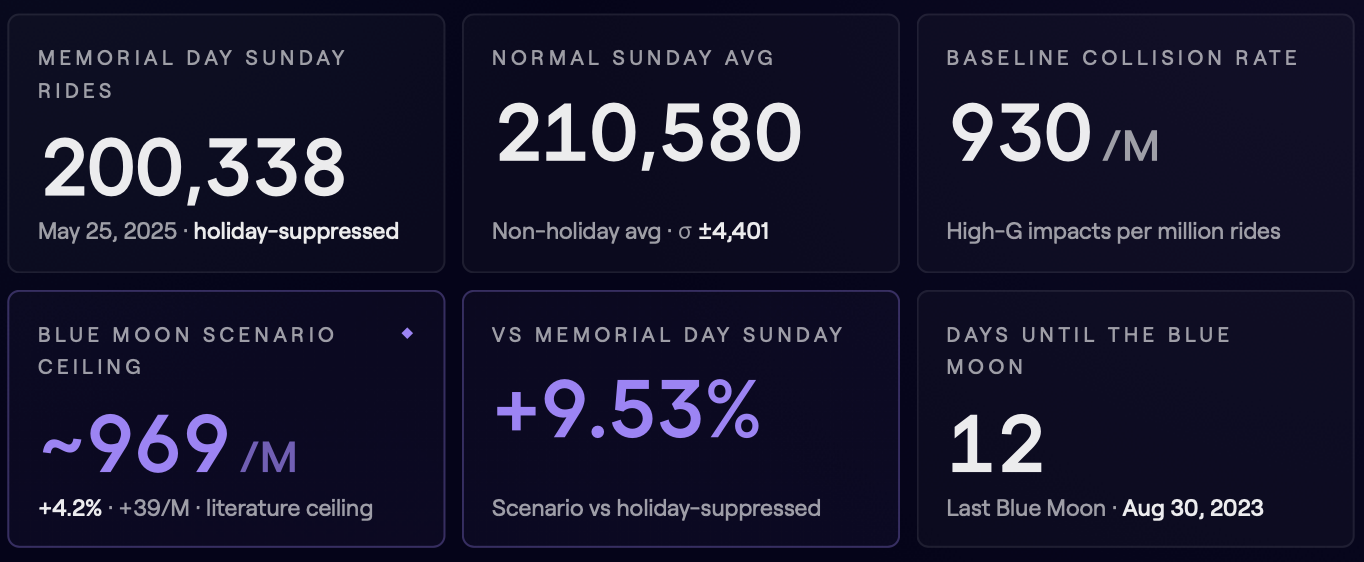
The full numeric snapshot — three baselines (non-holiday Sundays, Memorial Day Sunday, day-count to event) and three scenario points (rides, rate, % vs holiday).
◆ NOT A SUPERMOON: The May 31, 2026 Blue Moon occurs near lunar apogee — the farthest point in the Moon’s orbit — making it smaller and dimmer than an average full moon. This is the inverse of a supermoon. The +32% motorcycle crash spike found in the Princeton/JAMA supermoon literature explicitly does not apply here.
The two baselines (200,338 holiday Sunday and 210,580 non-holiday Sunday) bracket the study’s reference range. The scenario ceiling (969/M, +9.53% vs Memorial Day) is what the Japanese literature predicts as a maximum plausible effect. The 12-day countdown provides the framing window for pre-registering any analysis thresholds before the data arrives — a guard against confirmation bias on May 31 itself.

What Is a Blue Moon?
A Blue Moon is the second full moon to occur within a single calendar month. Because a lunar cycle is approximately 29.5 days, most months contain only one full moon. Roughly every 2.5 years, a month is long enough — and the timing favorable enough — to fit two full moons. That rare second occurrence is the Blue Moon.
The phrase “once in a blue moon” reflects this rarity. Despite the name, the Moon does not actually appear blue (barring unusual atmospheric conditions from wildfires or volcanic ash).
Once in a Blue Moon - next on May 31, 2026
Blue Moon timeline

Lunar Apogee · Why This One Is Smaller
The May 31, 2026 Blue Moon occurs near lunar apogee — the Moon’s farthest orbital point from Earth. The Moon will appear roughly 12–14% smaller in angular diameter and visibly dimmer than a supermoon. Expect reduced night-visibility enhancement compared to a perigee full moon. The light-driven mechanism behind any traffic effect is correspondingly weakened.
The Superstition Angle
The Blue Moon occupies a unique place in world mythology, folklore, and modern spiritual practice. Understanding these associations is relevant because behavioral effects — if any exist — are likely mediated through human perception, not lunar physics.
Folklore Traditions
The “Trickster Moon” (Celtic/folk)
A liminal event that falls “outside” the normal lunar calendar. In this framing, the Blue Moon is a window when the unexpected is more likely. Disruption & bad luck.
Auspicious & Protective (contemporary spiritual)
Most contemporary traditions view the Blue Moon as powerfully auspicious — charged for intention-setting and protective rituals. Heightened activity and gatherings.
The “Lunacy” Legacy (etymological)
The historical association between full moons and erratic behavior — embedded in “lunacy” itself — has been studied extensively. Meta-analyses consistently find no statistically significant behavioral effect.
The Real Mechanism (light, not mysticism)
To the extent full moons affect traffic at all, the operative mechanism appears to be increased ambient light after sunset — which extends outdoor activity windows and may create visual distraction.
✦ CONFIRMATION BIAS: The “lunacy” association persists despite a null literature because of confirmation bias: unusual events on full moon nights are remembered; full moons on quiet nights are not. Any genuine behavioral lift would have to push through this strong cognitive prior to register as a real signal — which is part of why the sub-noise effect modeled here is so hard to detect.
What the Literature Says
Six peer-reviewed studies are relevant. Effect sizes vary significantly by crash type, region, and study design.
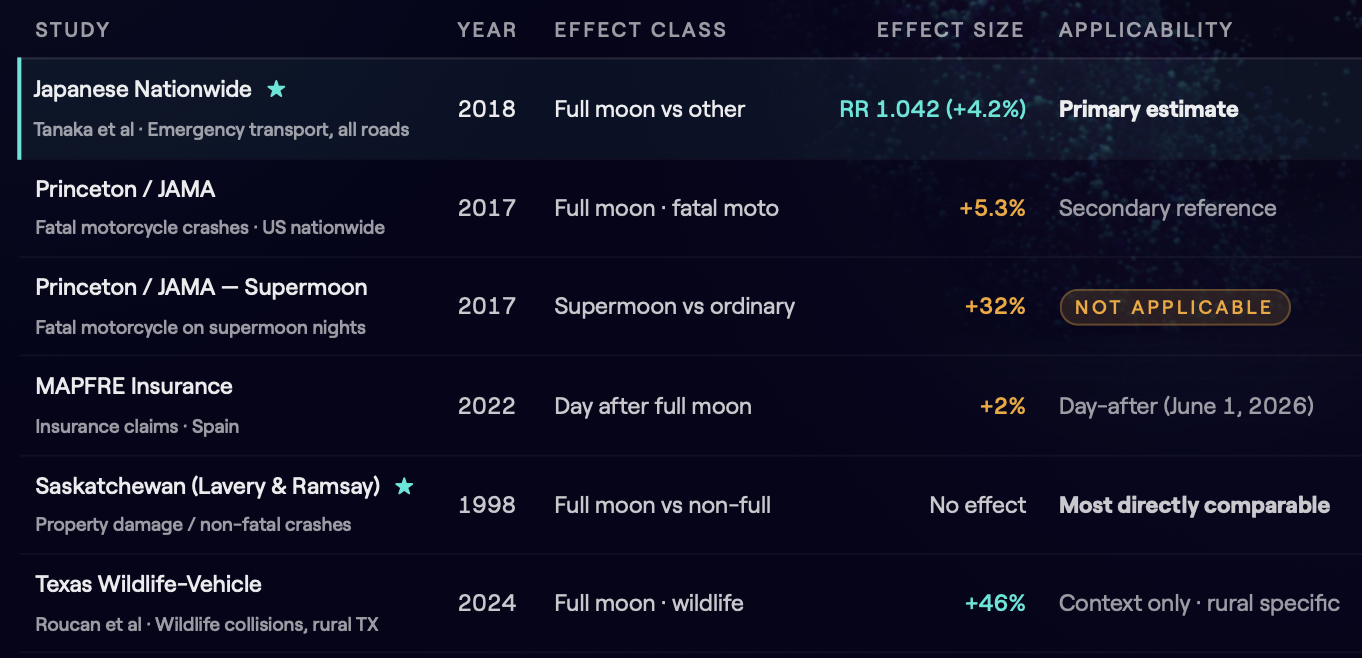
▲ LITERATURE HETEROGENEITY WARNING: The six studies span different countries, crash types, road types, time periods, and methodologies. A +46% effect for rural Texas wildlife collisions does not generalise to urban rideshare vehicles. The Saskatchewan null result for non-fatal crashes is arguably the most directly comparable to Nexar’s High-G Impact event class. The +4.2% Japanese estimate is used here as the defensible ceiling for the main scenario — not because it is certain, but because it is the most methodologically robust nationwide study.
Methodology & Data Sources
Data Source
All baseline metrics are derived from Nexar telematics data for the four Sundays of May 2025. Nexar operates a professional fleet intelligence platform covering primarily Taxi and Rideshare vehicles in the United States. The dataset covers ride-level records including duration, distance, vehicle-type classification, state, and onboard sensor events (high-G impacts, hard braking events).
Baseline Construction

Scenario Projection Method
The Blue Moon scenario applies the literature-derived relative risk of 1.042 (Tanaka et al., 2018) as a multiplicative modifier to the non-holiday rolling average baseline:
Projected rides = 210,580 × 1.042 = ~219,424
Projected collision rate = 930.05 × 1.042 = ~969 per million
Projected vs Memorial Day = (219,424 / 200,338 − 1) = +9.53%
This constitutes a ceiling scenario. Given (a) the Saskatchewan null result for the same crash class, (b) the professional fleet composition, and (c) the sub-noise signal size, the actual observed effect on May 31, 2026 may be zero.
Baseline · Last Sundays of May 2025
Four Sundays were observed in May 2025. May 25 (Memorial Day weekend) is the temporal anchor for the Blue Moon comparison; May 4 / 11 / 18 provide the non-holiday rolling average.
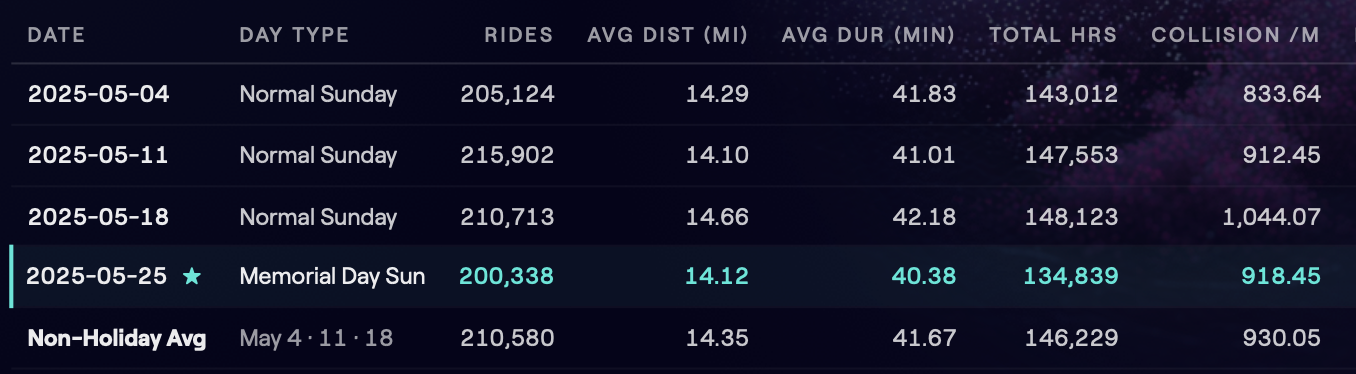
◆ MEMORIAL DAY EFFECT: −4.86% — Memorial Day weekend suppresses Taxi/Rideshare ridership by approximately −4.86% relative to the non-holiday Sunday average. May 25, 2025 is the temporal analog to the Blue Moon Sunday but is not a clean baseline — it carries a holiday discount.
▲ COLLISION RATE VARIANCE: ±75/M — The collision-proxy rate varied from 833.64 to 1,044.07 across the four Sundays — a range of 210 events/M and a week-to-week standard deviation of approximately ±75 /M. This intrinsic variance is the critical denominator for any significance assessment of the projected Blue Moon effect (+39 /M). The signal is smaller than the noise.
Hourly Traffic Pattern · May 25, 2025
The characteristic Sunday arc: slow early morning, steady build, peak at early afternoon, evening taper with a late-night residual. The nighttime window (20:00–04:00) is where full-moon-effect literature is most relevant.
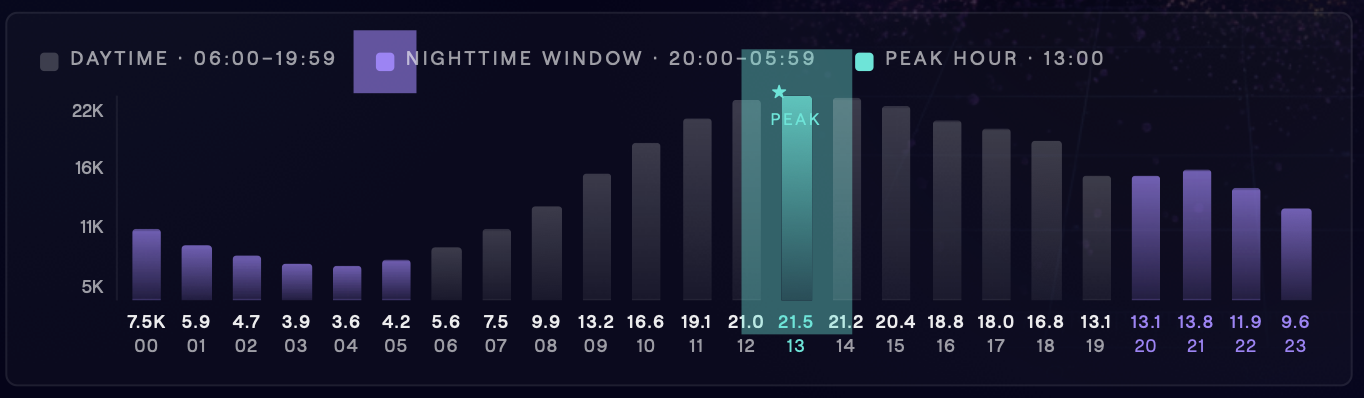
🌙 NIGHTTIME WINDOW · LITERATURE RELEVANCE: Full-moon traffic safety literature predominantly examines nighttime driving (typically 20:00–04:00), when increased ambient light has the greatest relative effect. In the Nexar May 25 dataset, approximately 55,000 rides occur between 20:00 and 04:00 the following day — roughly 27% of daily volume. If a full moon effect is present, this is the window where it would be most observable.
Fleet Composition
The Nexar fleet is dominated by Taxi and Rideshare vehicles (95.1% of all rides on May 25, 2025). This professional fleet composition is a critical moderating factor when applying general-population traffic literature.
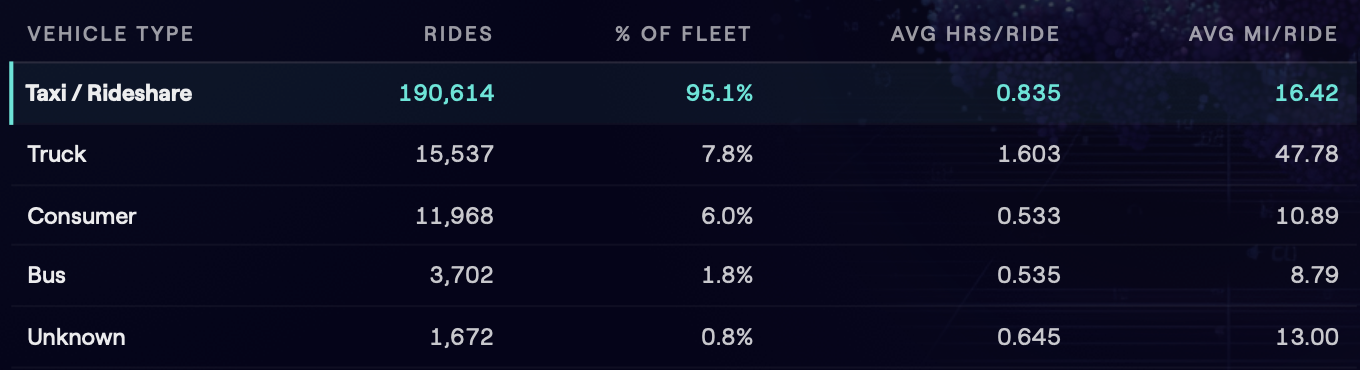
Note: vehicle types are not mutually exclusive in the classifier; percentages reflect classification flags, not partition shares.
95.1% PROFESSIONAL FLEET: Traffic studies documenting full moon effects typically sample general-population drivers. Professional drivers are likely subject to different behavioral patterns: higher accumulated fatigue exposure, professional training, reduced novelty-seeking behavior, and economic incentives to drive carefully. These factors may substantially attenuate any behavioral full moon effect relative to literature estimates.
▲ THE +4.2% AS UPPER BOUND: Given the professional-fleet composition, the +4.2% literature ceiling (Tanaka et al.) should be treated as an upper bound in this analysis. If the attenuation hypothesis is correct, the realised effect on May 31 may sit closer to the Saskatchewan null result than to the Japanese RR.
Geographic Distribution · Top 10 States
New York accounts for 22.2% of all rides — nearly double California’s share. The Tri-State (NY, NJ, PA = 30.8% of total) reflects the dense urban rideshare market. A full moon effect concentrated in NYC/Tri-State would dominate national figures.
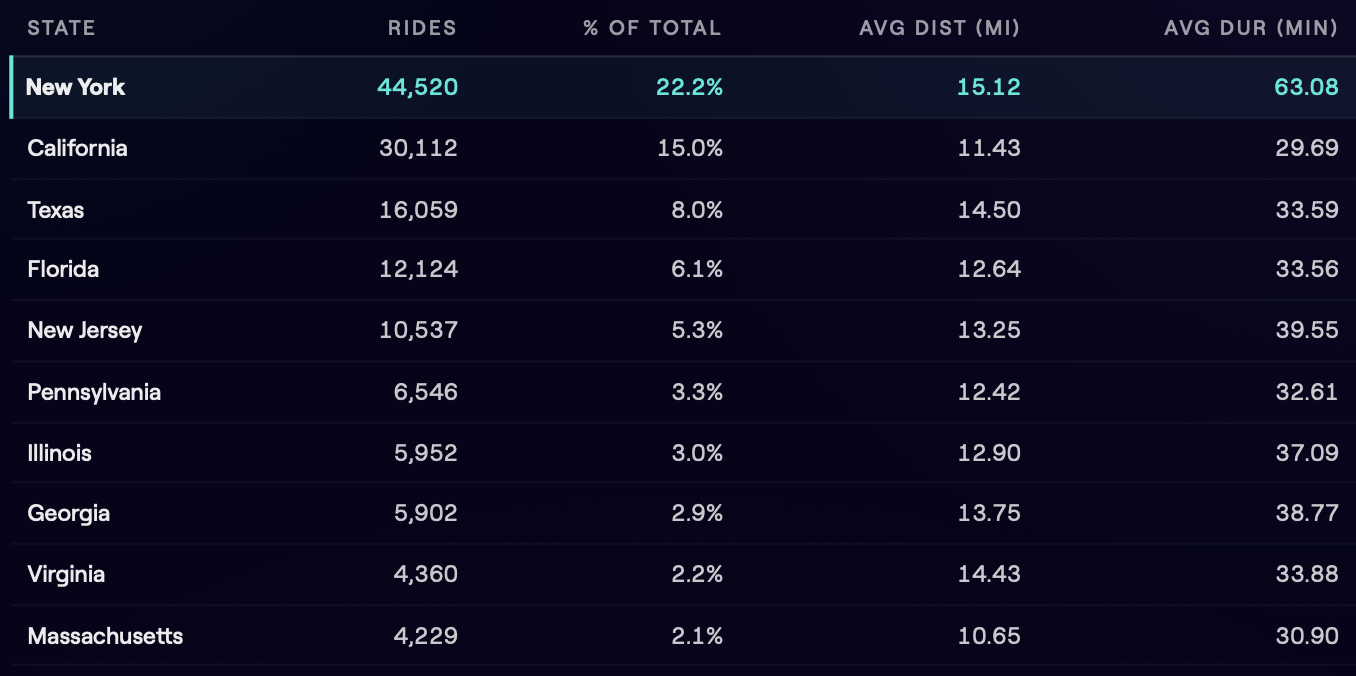
◆ NEW YORK DURATION OUTLIER · 63 MIN: New York rides average 63.08 minutes — more than twice the California average (29.69 min). This reflects NYC’s dense stop-and-go traffic and longer cross-borough routes. Extended-duration rides increase exposure time per ride, meaning any per-mile or per-hour incident rate would amplify differently in the NY market. Treat New York’s contribution to any May 31 national figure separately from the rest of the country.
Blue Moon Scenario Projections
Applying the Japanese nationwide RR of 1.042 as a ceiling multiplier to the non-holiday Sunday baseline produces the following scenario range.

◆ HOW TO READ THIS TABLE: The “Blue Moon Scenario” column represents the ceiling scenario — the maximum plausible effect if the Japanese RR of 1.042 holds for this fleet and event type. The actual outcome on May 31, 2026 may be anywhere from no effect (consistent with the Saskatchewan null result) to this ceiling. The most likely outcome is indistinguishable from a typical non-holiday Sunday.
Statistical Power Analysis
The projected effect size is +39 collision events per million rides. The observed week-to-week variance in the baseline is ±75 events per million (std dev). The signal-to-noise ratio is 39 / 75 = 0.52 sigma. This effect, if real, would require approximately 20–30 comparable full moon Sundays with consistent fleet composition to achieve statistical significance (p < 0.05, two-tailed). A single observation on May 31 is insufficient to confirm or refute the hypothesis.
Do not interpret May 31 data as either confirming or debunking the full moon hypothesis.
Statistical Limitations & Power Analysis
▲ Effect Below Detection Threshold - The projected +39 collision events per million rides is smaller than the week-to-week variance (±75/M) in the May 2025 baseline. The Blue Moon effect, if real, is sub-detectable from a single observation.
01 Sub-detectable signal size
The +39/M projected effect falls below the ±75/M intrinsic baseline variance. Statistical confirmation would require 20–30 comparable full moon Sundays. This is a scenario ceiling, not a verifiable single-day prediction.
02 Professional fleet vs general population
95% of Nexar rides are Taxi/Rideshare. All literature studies documenting full moon behavioral effects used general-population driver samples. Professional drivers likely behave differently — effects may be substantially attenuated or absent.
03 Not a supermoon — lunar apogee
The May 31, 2026 Blue Moon occurs near apogee (smallest apparent disk). The +32% motorcycle crash spike is supermoon-specific (Princeton/JAMA, 2017). That literature does not apply here. Reduced ambient light may attenuate the light-driven mechanism.
04 Year-over-year fleet change
Projections are based on May 2025 data. Fleet size, geographic distribution, and vehicle-type composition may have changed materially by May 2026. The baseline should be updated with actual May 2026 non-holiday Sunday data when available.
05 Memorial Day confound
May 25, 2025 (the closest temporal analog) was a holiday weekend, suppressing ridership by ~4.86%. It is not a clean baseline Sunday. The non-holiday rolling average is the more appropriate statistical baseline.
06 Saskatchewan null result for non-fatal crash class
Lavery & Ramsay (1998) found no full moon effect for property damage and non-fatal crashes — the crash class most analogous to Nexar’s High-G Impact metric. This null is arguably the most directly applicable study and was not used as the primary estimate.
What To Watch For on May 31, 2026
The Blue Moon rises on Sunday, May 31, 2026. Six concrete observational targets — not predictions, but data-informed questions to answer as May 31 data arrives.
Nighttime Window (20:00–00:59 Local Time)
Full-moon literature effects are overwhelmingly nighttime phenomena. Watch the 20:00–00:00 window where ambient light effects are greatest. ~37,000 rides expected in this window.
Geographic Concentration (New York & Tri-State)
New York (22%) and the Tri-State region (31% combined) dominate national figures. Dense urban night environments with high pedestrian-vehicle interaction are the most likely signal location. Watch NY rates independently.
Ride Volume vs Baseline (Threshold: 215,000 rides)
A ride count above ~215,000 would be noteworthy; above ~219,000 aligns with the ceiling scenario. Compare to 2026 non-holiday rolling average, not 2025.
Hard Braking Rate (Baseline: 44,621/M)
Hard-braking events (the real-time precursor to collisions) showed the highest variance in May 2025: 42,062 to 47,310 per million. A hard-braking rate above 48,000/M on May 31 would be a statistically notable exceedance worth investigating.
Day-After Signal (June 1, 2026 · Monday)
The MAPFRE insurance study documents a +2% claims increase on the day after a full moon. June 1, 2026 is a Monday. Watch Monday morning (06:00–10:00) incident rates for any post-full-moon fatigue signal.
Taxi vs Consumer Split
If a full moon behavioral effect exists in the fleet, it is more likely to appear in the Consumer segment (6%, general-population drivers) than in Taxi/Rideshare. Segment the May 31 incident rate by vehicle type for the most sensitive signal detection.
● THE NULL HYPOTHESIS MATTERS TOO: If May 31 data shows collision rates within ±1 sigma of the May 2025 non-holiday baseline, that is a meaningful null result in its own right — and publishable context for the “full moon effects in professional fleet telematics” research gap. Do not interpret a normal May 31 as “nothing happened.” It confirms the professional fleet insulation hypothesis.
Key Findings
Six headline findings — three on baselines and scenario ceiling, three on detectability and moderating factors.
Recommendations
Five actions for May 31 analysis and beyond — operationally precise, methodologically clean.
01 UPDATE BASELINE
Replace May 2025 baseline with May 2026 non-holiday Sundays
As May 2026 data becomes available (May 3, 10, 17), construct a May 2026 rolling average to replace the 2025 baseline. Fleet composition and size may have changed materially.
02 SEGMENT THE ANALYSIS
By nighttime window and vehicle type
The highest-sensitivity analysis will segment by (a) 20:00–00:59 local time and (b) Consumer vs Taxi/Rideshare vehicle type. National daily averages are too coarse to detect a 4% signal.
03 FLAG JUNE 1 MONDAY
Day-after analysis · MAPFRE +2% signal
The MAPFRE day-after signal (+2% claims) warrants a specific Monday morning lookback on June 1, 2026. Compare to prior Monday baselines — not to Memorial Day weekend figures.
04 METHODOLOGY TEMPLATE
Repeat for next full moon · June 29, 2026
This is the first application of full moon traffic literature to professional fleet telematics. The methodology — literature RR applied to fleet baseline with power analysis — is repeatable for the next full moon and future Blue Moons.
05 AVOID CONFIRMATION BIAS
Pre-register analysis thresholds before May 31
The null hypothesis has equal standing: a normal May 31 is as scientifically meaningful as an elevated one. Do not selectively report results. Pre-register thresholds before the data arrives.
Data Notes & Caveats
▲ Critical Caveats — Read Before Citing
• This analysis is forward-looking. All projections are scenarios, not predictions.
• The +4.2% effect estimate is a literature-derived ceiling, not a verified Nexar finding.
• The Saskatchewan null result for non-fatal crashes is arguably more applicable to Nexar’s High-G metric than the Japanese emergency-transport RR.
• Nexar’s collision proxy (High-G impact event) measures sudden deceleration, not confirmed collision outcomes. Mapping to real-world crash rates introduces additional uncertainty.
• State-level data reflects Nexar fleet coverage, not population-representative sampling.
• Year-over-year fleet changes are unquantified. May 2025 data is the only available baseline.
Collision Proxy Definition
Nexar’s “collision rate” metric in this study refers to high-G impact events per million rides — onboard sensor detections of sudden deceleration events exceeding a defined g-force threshold. This is a proxy for high-risk events, not a confirmed crash count. The Saskatchewan null result (no full moon effect for non-fatal crash class) was found using police-reported crash data — a higher-confirmation threshold than Nexar’s sensor-based proxy.
Literature Citations

Want to dive deeper?
Nexar helps industry leaders turn vision into value. Dive into real-world success stories where our data redefined the road ahead - and see what it can do for you.