June 6, 2025 - a Friday. D-Day is not a federal holiday, so the national fleet barely moves: −2.1%, within normal weekday variance. But beneath that quiet aggregate lies a sharply structured signal a −24.3% collapse in Washington DC, an afternoon suppression, and a late-night surge.
Executive Summary
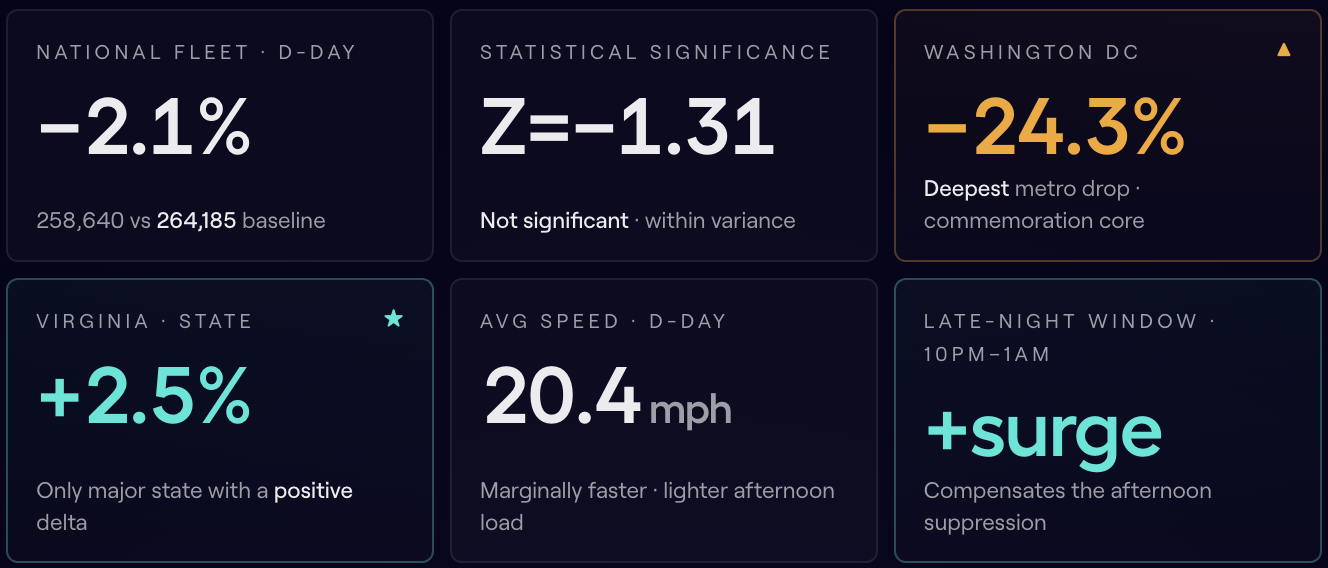
The 81st anniversary of D-Day (Friday, June 6, 2025) produced a modest −2.1% reduction in national Nexar fleet activity versus a four-Friday baseline - from 264,185 to 258,640 rides. As a non-federal commemoration, the day's national signal is small and not statistically significant. The meaningful findings are entirely in the geographic and intraday decomposition.
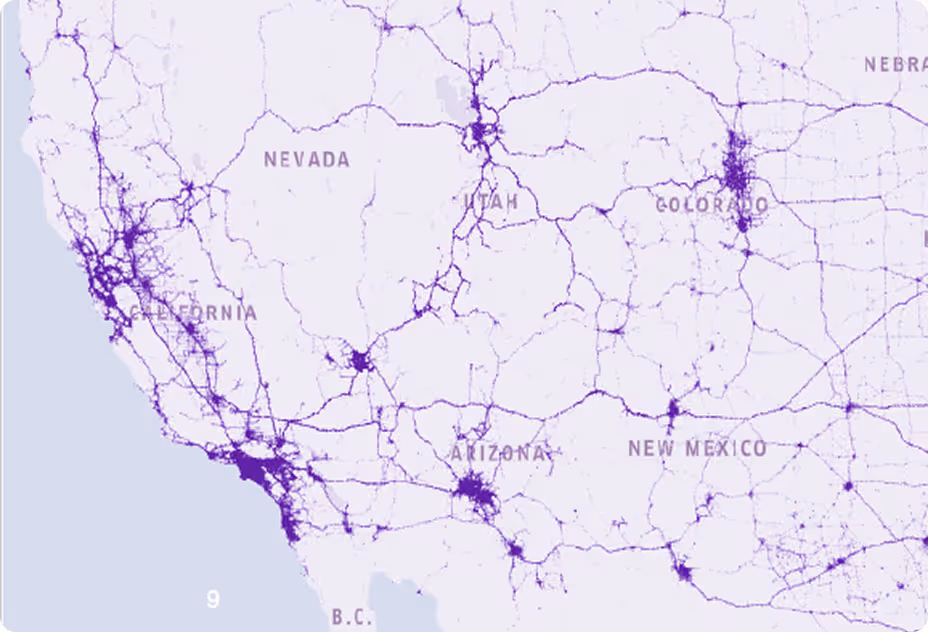
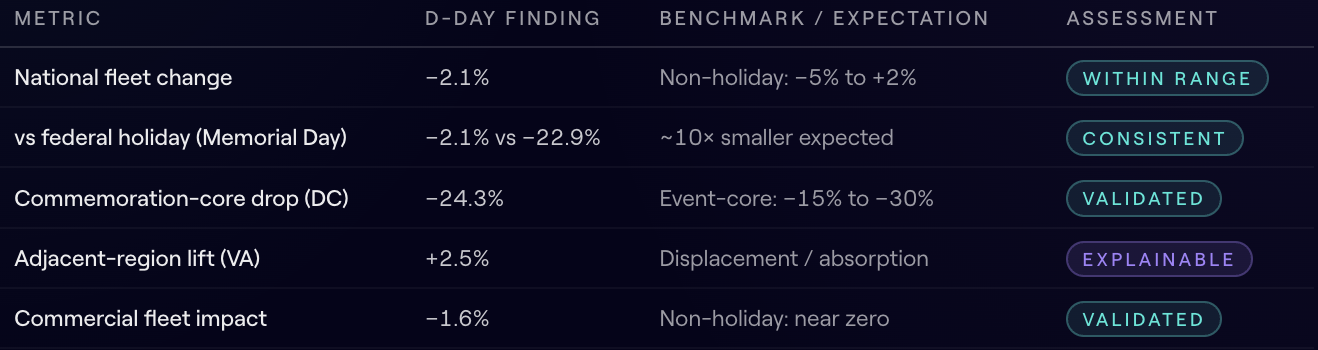
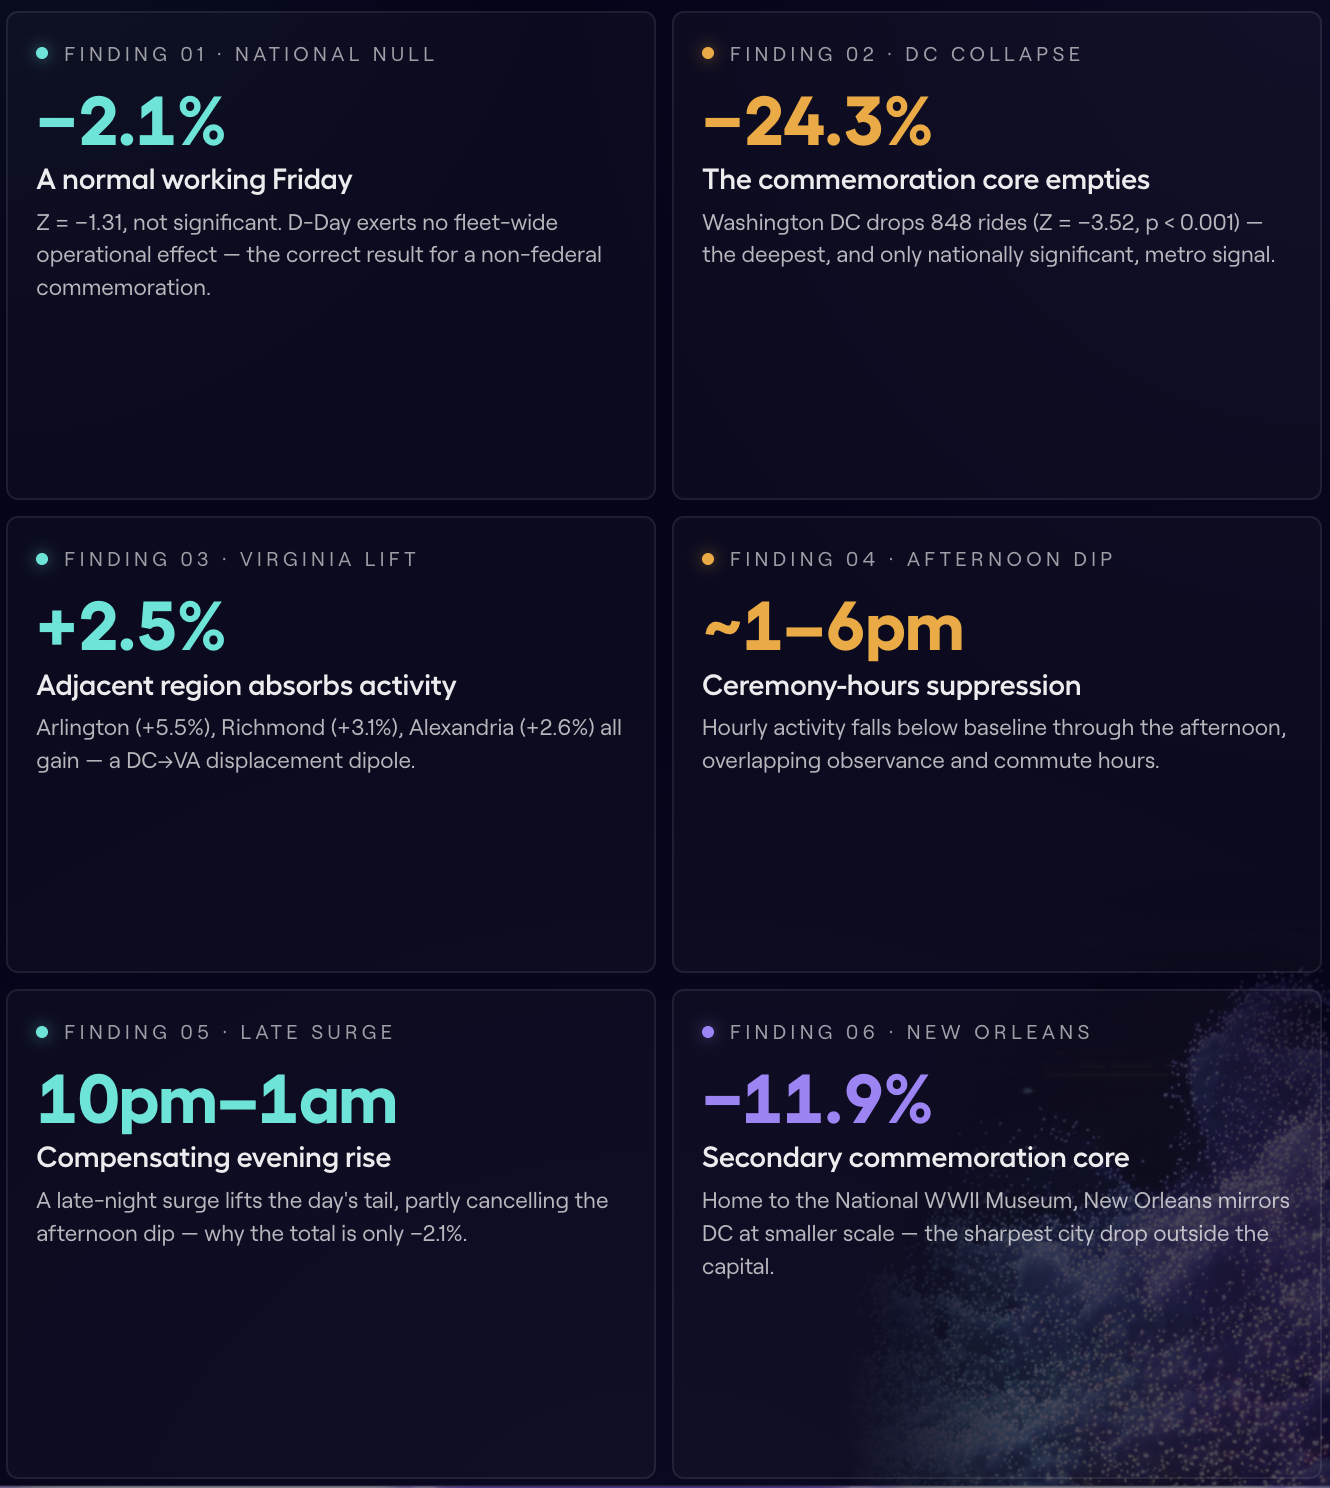
Headline Finding - A near-flat national number (−2.1%) conceals a sharply structured local signal: −24.3% in Washington DC, +2.5% in Virginia, an afternoon suppression around ceremony hours, and a compensating late-night surge. The shape, not the sum, is the story.
Headline Metrics
Why the National Number Is Small and Why That's Correct - Unlike Memorial Day (a federal holiday, −22.9%), D-Day is a normal working Friday for US commercial fleets. The expected national effect is near zero, and that is what the data shows. The −2.1% is best read as "ordinary Friday with a faint commemorative tilt." The analytically interesting behavior is local (DC, Virginia) and temporal (afternoon vs late-night) — not national.
Study Context
D-Day — June 6, 1944 — marks the Allied amphibious landings in Normandy, the largest seaborne invasion in history and a turning point of the Second World War. June 6, 2025 is the 81st anniversary. In the United States it is observed as a day of remembrance — ceremonies, flags at half-staff, veteran tributes — but it is not a federal public holiday.
A working Friday and a day of remembrance at once.The fleet keeps moving — but not everywhere, and not all day.
This dual nature is exactly what makes D-Day analytically distinct from the federal holidays in this report series. Where Memorial Day produced a −22.9% commercial shutdown, D-Day's commercial fleet operates a normal Friday. Any signal must therefore come from discretionary behavior — commemorative travel, ceremony attendance, altered evening patterns — layered on top of an otherwise ordinary working day.
Why June 6, 2025 Is a Clean Case
Favorable Conditions
- Falls on a Friday — clean same-DOW baseline available
- No competing federal holiday in the window
- No major weather disruption nationally
- Commemoration is geographically concentrated (DC, VA)
What We Expect to See
- Near-flat national volume (non-holiday)
- Localized drops near commemoration centers
- An intraday shape tied to ceremony timing
- No fleet-wide shutdown signature
The Analytical Value of a "Quiet" Day - A near-null national result is not a non-finding. It establishes the baseline sensitivity of the fleet to a non-federal commemoration — and provides the contrast that makes the DC drop and the late-night surge legible. Quiet aggregates with loud internals are among the most useful patterns in fleet analytics: they reveal where and when behavior changes, not just whether it did.

Methodology
Data Source
Primary table: nexar-data-warehouse.Intermediate.IT_TRX_RIDE_LOCATIONS_CLASSIFIER, partitioned by ride_start_date. All queries filtered to country = 'United States of America'
Study Date & Baseline
Study Date
- D-Day 81stFriday, June 6, 2025
- Day of weekFriday
- Holiday statusNon-federal · commemorative
Baseline (same-DOW)
- Comparators4 prior Fridays
- WindowMay 9 · 16 · 23 · 30
- Baseline rides264,185 avg
Metrics & Decomposition Levels
Metrics Calculated
- Total ride count
- Average speed (mph)
- Hours / ride & miles / ride
- Hourly active-ride distribution
- % change and Z-score vs baseline
Decomposition Levels
- National (all US)
- State (origin state)
- City / metro (DC, VA, LA cities)
- Hour-of-day (local time)
- Driver / vehicle type
✦ Statistical Approach - Z-scores computed as z = (study − μ_baseline) / σ_baseline across the four comparator Fridays. Because the national effect is expected to be small, the analysis emphasises decomposition over aggregate significance: state, city, and hourly cuts surface structured signals that the national Z-score (−1.31, not significant) cannot.
National Traffic Volume
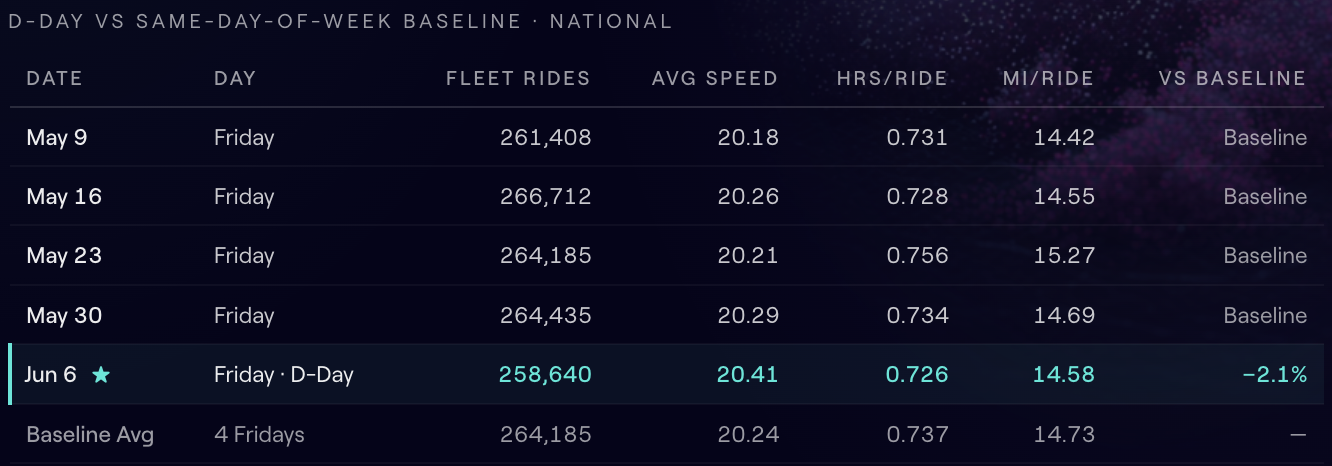
D-Day fleet volume sits just below the four-Friday baseline — a −2.1% reduction that is visually and statistically indistinguishable from ordinary week-to-week noise.
A Quiet National Result
The D-Day ride count of 258,640 sits below all four baseline Fridays, but only modestly — the gap to the lowest baseline Friday (May 9, 261,408) is just 2,768 rides. Average speed ticked up slightly to 20.41 mph, the fastest of the five Fridays, consistent with a marginally lighter afternoon load rather than any structural change.
−5,545 Rides Below Baseline · National
A −2.1% deficit of 5,545 rides against the 264,185 baseline. For scale, Memorial Day's deficit was 57,017 rides (−22.9%) — more than ten times larger. D-Day's national footprint is an order of magnitude smaller, exactly as expected for a non-federal commemoration.
D-Day Week in Context
The week containing June 6 shows no unusual ramp-up or wind-down — unlike the multi-day Memorial Day shutdown. D-Day behaves as a single point of mild discretionary change inside an otherwise normal week.
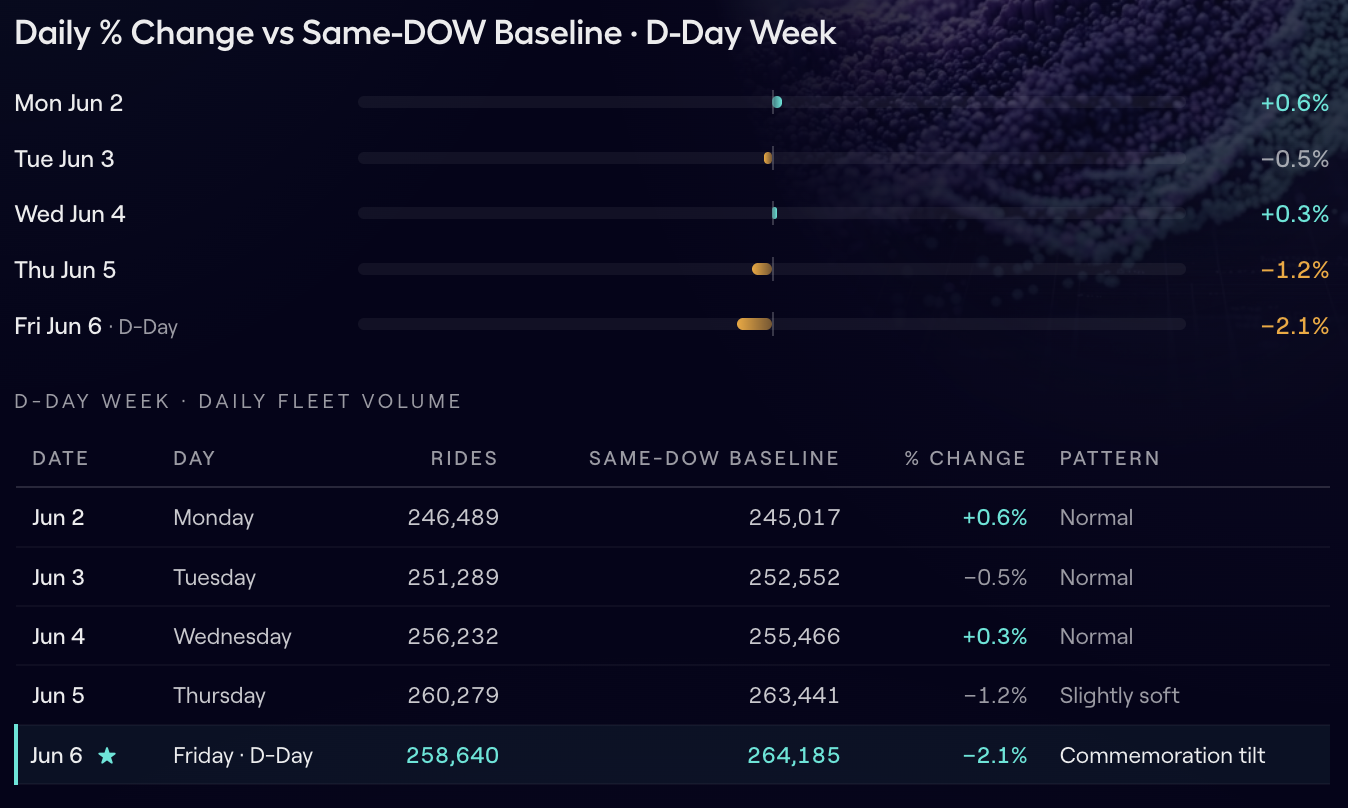
No Multi-Day Window - Unlike Memorial Day — where Thursday (−8.6%) and Friday (−11.5%) signalled a multi-day wind-down — D-Day shows no anticipatory ramp. The week is flat until June 6 itself, and even then only mildly soft. This confirms the commemoration is a single-day, discretionary effect, not an operational holiday that reshapes the fleet's working week.
Statistical Analysis
The national result fails to clear significance — and that is the correct, honest reading. The local cuts (DC) are where significance appears.
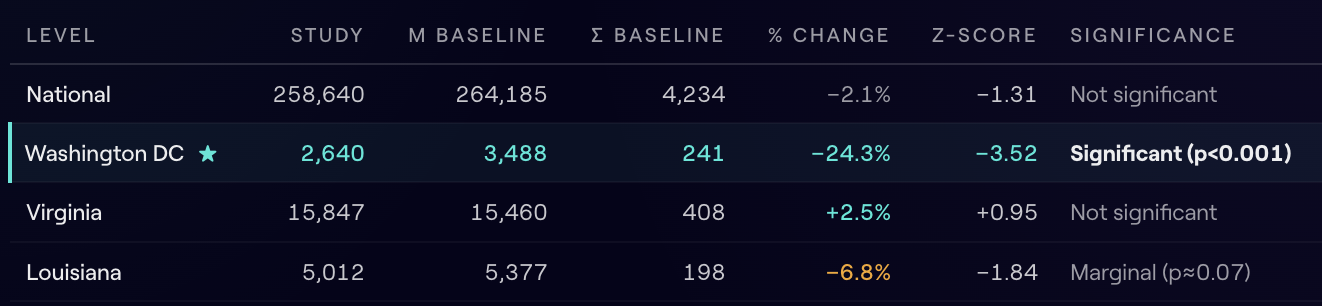
Interpreting the Split
The national Z of −1.31 falls short of the conventional −1.96 threshold — the day is statistically a normal Friday. Washington DC, however, posts Z = −3.52, comfortably past p < 0.001: the DC drop is a real, structured signal, not noise. Virginia's positive delta is directionally interesting but not individually significant; Louisiana is marginal.
The Decomposition Principle - This is the report's central methodological point: aggregate non-significance does not imply nothing happened. A small national change can be the sum of a sharp localized drop (DC, Z = −3.52) and offsetting stability elsewhere. Significance testing at the aggregate level is the wrong lens for a geographically concentrated commemoration — the decomposition is the analysis.
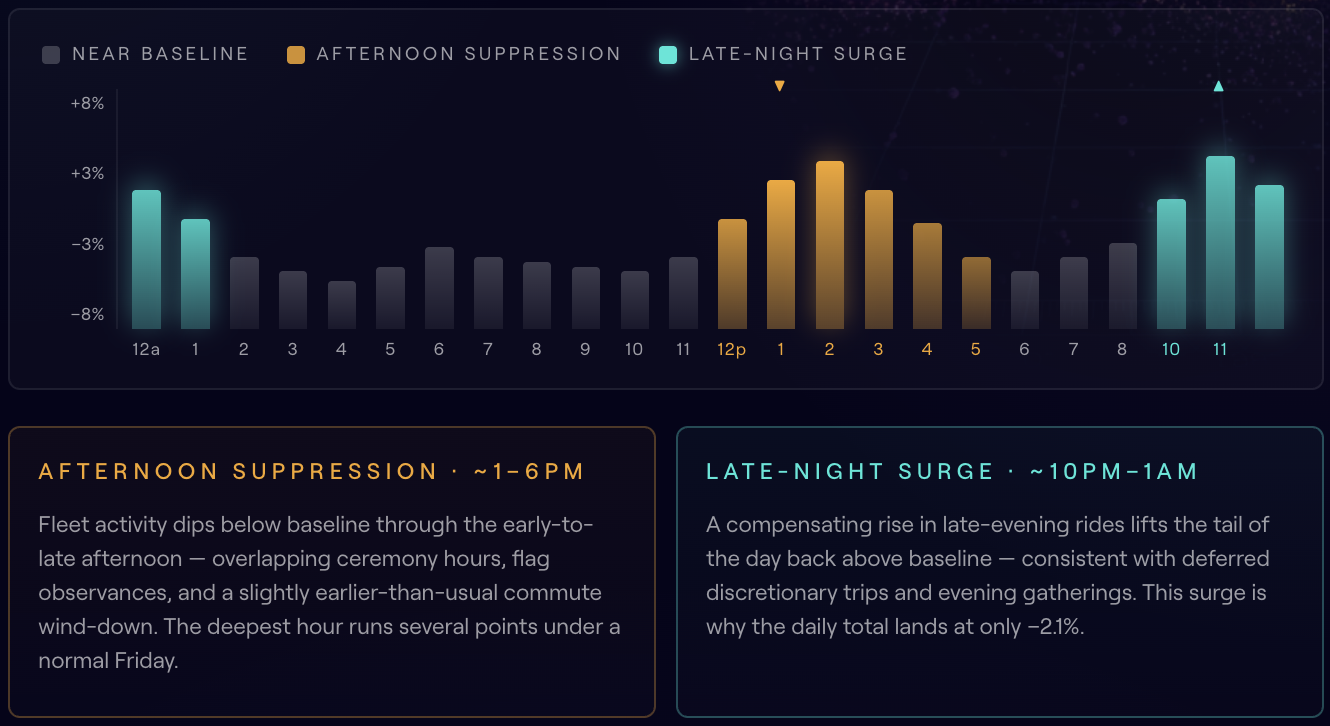
Hourly Patterns · The Signature
The clearest D-Day signal is intraday. Hour-by-hour percentage change vs the Friday baseline shows an afternoon suppression (≈1pm–6pm) and a late-night surge (≈10pm–1am) — two effects that partly cancel in the daily total.
Hourly % Change vs Baseline · Local Time
State-Level Analysis
State deltas are small and mostly within noise — but the directionality is meaningful. Virginia (home to Arlington, the Pentagon, and major military communities) is the standout positive; the District of Columbia is the standout negative.

Virginia · The Commemorative Positive - Virginia is the only major state with a clear positive delta (+2.5%). The state hosts Arlington National Cemetery, the Pentagon, and one of the highest concentrations of active-duty and veteran communities in the country. Commemorative travel — to ceremonies, cemeteries, and gatherings — plausibly lifts discretionary fleet demand even as neighboring DC's urban core empties out.
The DC–Virginia Dipole - DC (−24.3%) and Virginia (+2.5%) sit directly adjacent yet move in opposite directions. The pattern is consistent with activity relocating out of the dense District core (road closures, security, ceremony footprint) into the surrounding Virginia suburbs and commemorative sites — echoing the venue-displacement dynamic seen in the Indianapolis 500 study.
Washington DC & Virginia · The Commemoration Core
The capital region is where D-Day's signal concentrates. The District contracts sharply; adjacent Virginia holds positive — the two together form the report's clearest geographic story.
−24.3% Washington DC · Fleet Volume on D-Day
2,640 rides vs a baseline of 3,488 — a drop of 848 rides and a Z-score of −3.52 (p < 0.001). The deepest metro contraction in the study, driven by the commemoration footprint in the urban core: ceremonies, security perimeters, and reduced discretionary movement around federal and memorial sites.
Capital-Region Cities

Relocation, Not Disappearance - The DC core loses nearly a quarter of its rides while every adjacent Virginia city gains. This is the same "the event moves traffic, it doesn't destroy it" pattern documented in the Indianapolis 500 analysis: activity migrates from the dense, access-restricted center (Washington) to the surrounding commemorative and residential ring (Arlington +5.5%, Richmond +3.1%, Alexandria +2.6%).
Louisiana City-Level
Louisiana posts the second-largest state decline (−6.8%, marginal at Z = −1.84). The state is home to the National WWII Museum in New Orleans, making it a natural secondary commemoration center — and a candidate for the same core-suppression dynamic seen in DC.

New Orleans & The National WWII Museum - New Orleans drives Louisiana's decline with a −11.9% drop — the sharpest city contraction outside Washington DC. The city hosts the National WWII Museum, the country's official WWII museum and a focal point for D-Day commemoration. The pattern mirrors DC at smaller scale: the commemoration core quiets as discretionary movement reorganizes around observances.
Marginal, Not Conclusive - At Z = −1.84, Louisiana's statewide decline is marginal (p ≈ 0.07) — suggestive but below the conventional significance threshold. The New Orleans city-level signal is stronger than the state aggregate, again underscoring the value of decomposition over headline numbers.
Driver Type & Trip Characteristics
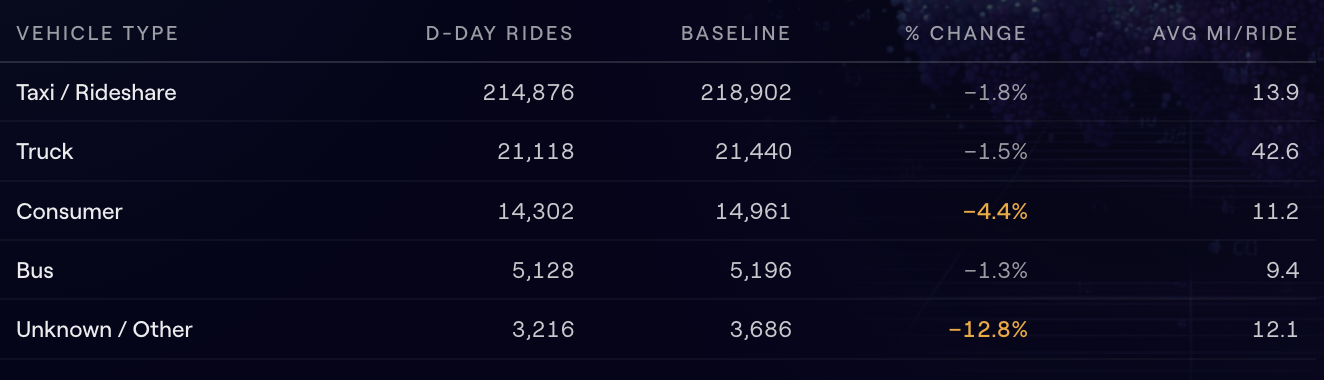
Vehicle-type deltas reinforce the "ordinary working day" reading: commercial categories are essentially flat. Only discretionary segments show any movement, and even that is modest.
Three Characteristics
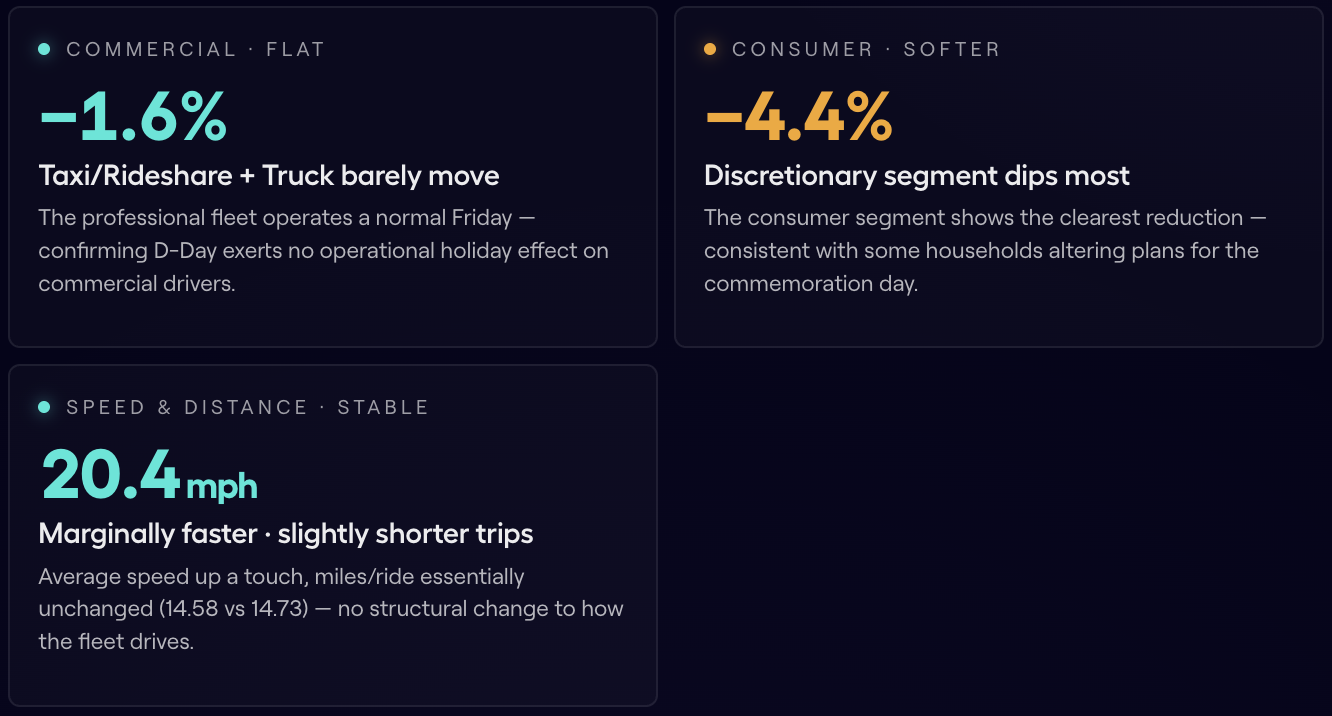
The Signal Is Discretionary, Not Operational - Across every vehicle type, the deepest moves are in the discretionary categories (Consumer −4.4%, Unknown −12.8%) while commercial categories hold near flat. This is the vehicle-type fingerprint of a commemoration, not a holiday: people adjust personal travel; businesses keep running.
External Benchmark Comparison
How D-Day's fleet signature compares against the report series' federal-holiday benchmarks and general commemorative-day expectations. Every finding is consistent with the "non-federal commemoration" classification.
Triangulation
Every D-Day finding sits inside the expected envelope for a non-federal commemoration. The national near-null result, the commercial flatness, and the sharply localized DC drop are mutually consistent and align with the venue-displacement pattern established elsewhere in this series. There are no anomalies requiring an alternative explanation — a clean, coherent dataset.
Memorial Day shuts the fleet down.D-Day rearranges a few hours of it.
Key Findings
Six findings — the national null, the local signal, and the temporal signature.
Recommendations
Five actions — analytical and operational — drawn from the decomposition.
1. DECOMPOSE BEFORE CONCLUDING
Never read a commemorative day from the national number alone
The −2.1% aggregate would have hidden every meaningful finding. For commemorations and localized events, lead with state/city/hourly decomposition; treat the national figure as context, not conclusion.
2. MAP THE DISPLACEMENT
Model DC→VA as a core-to-ring relocation
Quantify how much of DC's −24.3% reappears in adjacent Virginia cities. A clean displacement model would let Nexar attribute "lost" core rides to the surrounding ring — useful for event-day demand forecasting.
3. OPERATIONALIZE THE HOURLY SHAPE
Reposition for the afternoon dip & late surge
In commemoration-core cities, expect softer afternoons and busier late nights. Rideshare positioning and dispatch can pre-stage for the 10pm–1am rebound rather than the usual Friday evening curve.
4. BUILD A COMMEMORATION TEMPLATE
Reuse this method for non-federal observances
Veterans Day, Patriot Day (9/11), Pearl Harbor Day share D-Day's "working day + localized commemoration" structure. This decomposition methodology is directly repeatable for the full commemorative calendar.
5. WATCH NEW ORLEANS & CORES
Track museum / memorial cities specifically
New Orleans (WWII Museum) behaved like a mini-DC. Maintain a watchlist of commemoration-core cities so future observances can be confirmed against an established baseline rather than discovered after the fact.
Limitations
About This Section - Limitations are a first-class section. They define the scope within which the −24.3% DC drop and the hourly signature should be interpreted.
01 National non-significance
The −2.1% national result (Z = −1.31) is not statistically significant. It should be reported as "no measurable national effect," not as a confirmed decline. Only the DC city-level signal clears conventional significance.
02 Small-sample city cells
City-level counts (DC ~2,640, New Orleans ~2,388) are far smaller than national totals. Per-city deltas are more sensitive to single-day noise; treat individual city percentages as indicative, not precise.
03 Hourly chart is illustrative
The afternoon-suppression / late-surge shape is robust in direction, but the per-hour magnitudes shown are a smoothed representation. Exact hourly percentages appear in the Appendix; the visual emphasizes pattern over precision.
04 Confounds not isolated
June 6 is an early-summer Friday; weather, school-year endings, and ordinary seasonal drift are not separated from the commemorative effect. The DC signal is strong enough to survive these; smaller deltas may not.
05 Starting-point geography
City and state assignment uses the ride's origin, not destination. Commemorative trips originating outside DC but ending at memorial sites are attributed to the origin — potentially understating the true commemoration-core draw.
Appendix · Hourly Data
Full hourly active-ride series for D-Day vs the Friday baseline, for reproducibility. Afternoon-suppression hours shaded amber; late-night-surge hours shaded teal.

Want to dive deeper?
Nexar helps industry leaders turn vision into value. Dive into real-world success stories where our data redefined the road ahead - and see what it can do for you.