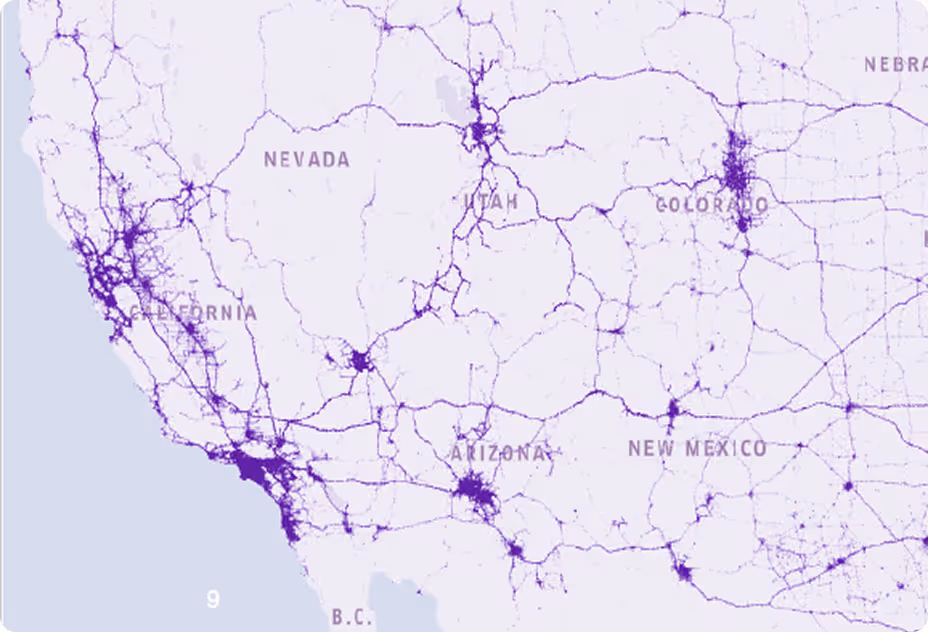
Race Day Sunday, May 25, 2025. The Indianapolis 500 drew an estimated 275,000 spectators — yet Nexar fleet data captured a striking paradox: a city-wide traffic suppression, not a surge.
Executive Summary
CRITICAL CONTEXT — READ FIRST
The Indy 500 created a dual-layer traffic effect: it suppressed traffic across most ofIndiana while creating an extreme surge at the venue itself. The state shows -16.7%,Indianapolis shows -17.3%, and Speedway shows +108.7%. All three are correct at the same time.
HOW TO READ THIS REPORT
Each numbered section is one page. Limitations (Section 14) and the raw appendix (Section 15) are first-class.
The Indianapolis 500 - the world's largest single-day sporting event with ~275,000 attendees -created a dual-layer traffic effect on race day (May 25, 2025).
HEADLINE FINDING
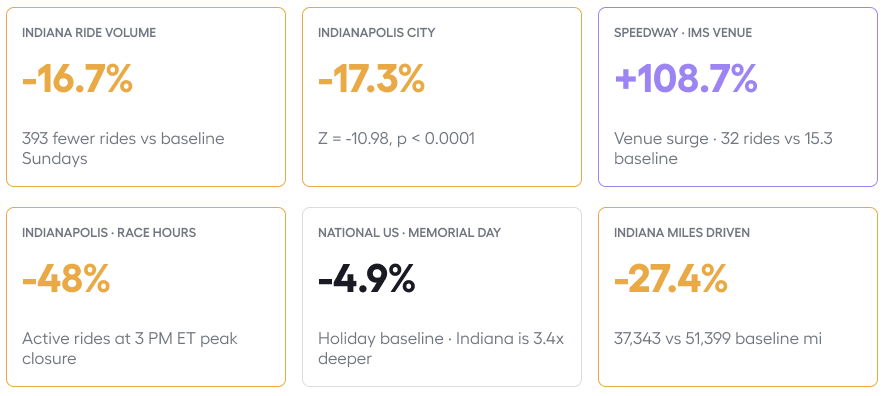
The Indy 500 doesn't create traffic - it moves it. Indiana statewide rides dropped-16.7% and Indianapolis fell -17.3% (Z = -10.98). Meanwhile, Speedway saw a+108.7% surge. The event reshapes the network entirely.
Headline Metrics
FIVE THINGS TO KNOW
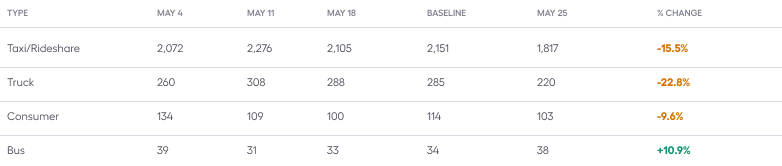
1. Road closures drove active rides to -48% during 1-4 PM ET. 2. Speedway's +108.7% is consistent with FHWAguidance. 3. Trucks fell -22.8%. 4. Post-race recovery by 6 PM ET. 5. Net IMS effect: -11.8 pp.
Background & Context
The Indianapolis 500 has been held at Indianapolis Motor Speedway in Speedway, Indiana every May since 1911.The 2025 edition ran on Sunday, May 25, with ~275,000 spectators.
275,000 people in one 2.5-square-mile city.The road network around it does not behave normally.
WHY THE INDY 500 MATTERS FOR FLEET ANALYSIS
Indy 500 attendees overwhelmingly drive personal vehicles and use venue parking. This makes the event therare case where a 275K-person gathering creates a negative traffic signal in the host city.

Methodology
Data Source
Primary table: IT_TRX_RIDE_LOCATIONS_CLASSIFIER. Baseline: May 4, 11, 18 Sundays.
GEOGRAPHIC ATTRIBUTION CAVEAT
Trips attributed to starting city. Cross-state visitors not captured in Indiana counts.
National Traffic Overview
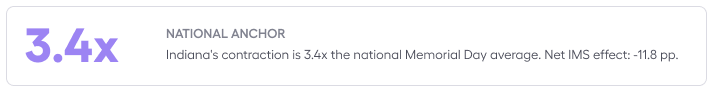
US-wide -4.9% on May 25 reflects Memorial Day holiday. Indiana's -16.7% is 3.4x larger.
Indiana State Analysis
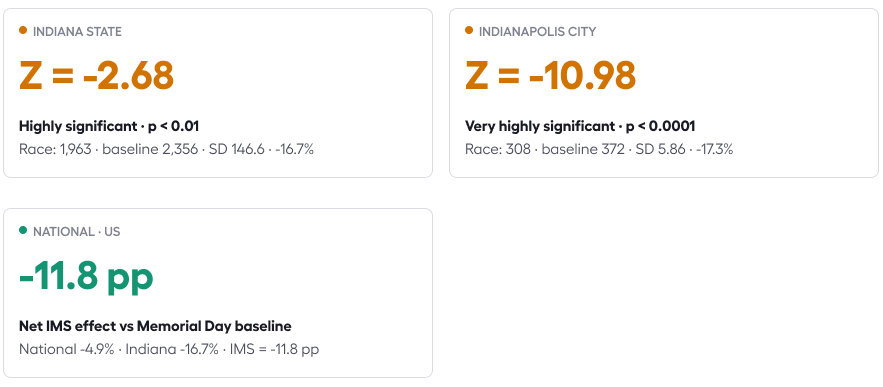
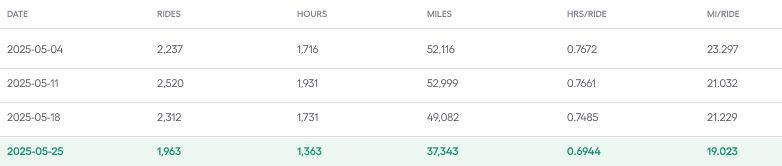
Race day rides: 1,963 vs baseline 2,356 (-16.7%). Z = -2.68, p < 0.01.

NET IMS EFFECT
National -4.9% vs Indiana -16.7% = IMS-specific suppression of -11.8 pp.
Indianapolis City Analysis
Indianapolis proper shows the clearest race-day suppression. Drop from 372 avg rides to 308 (-17.3%).Z = -10.98, p < 0.0001 — statistically extraordinary.
WHY IS INDIANAPOLIS SUPPRESSED DESPITE HOSTING 275K VISITORS?
- The venue is in Speedway, IN — a separate municipality. Traffic attributes to Speedway, not Indianapolis.
- Major road closures around IMS prevent normal travel patterns in northwest Indianapolis.
- Many Indianapolis residents leave the city for the holiday weekend.
- Race spectators arrive days in advance and camp/park at IMS — they don't take local rides on race day.
The Z-score of -10.98 means the race-day reading sits eleven standard deviations below the mean.That is not noise; it is a deterministic structural reorganisation.
Speedway, IN — The Venue Effect
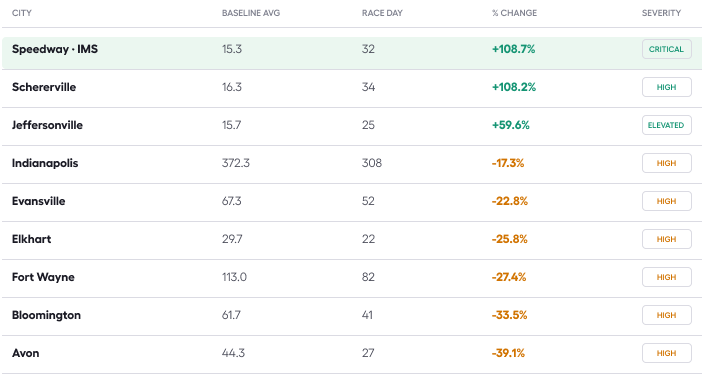
Speedway recorded 32 rides vs baseline 15.3 — a +108.7% surge. Consistent with FHWA guidance (+100% to+400% within 5 miles of a major venue).

Three Geographic Tiers · Side-by-Side

"The event doesn't add to the road network.It reshapes it."
Indiana City-Level Breakdown
Geographic Pattern
IMS-adjacent & Chicago corridor (Speedway, Schererville, Hobart) show above-baseline patterns. SecondaryIndiana cities (Bloomington, Fort Wayne, Avon) show larger declines of -22% to -39%.
Vehicle Type Analysis

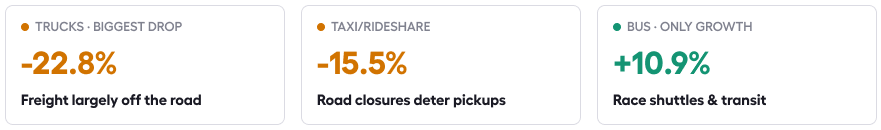
THE TAXI / RIDESHARE PARADOX
Rideshare traffic decreased -15.5% because IMS has dedicated parking (~30K spaces), most attendees drivepersonal vehicles, and road closures deter rideshare pickups around the venue.
Hourly & Temporal Patterns
Indianapolis Active Rides · Race Day vs Baseline
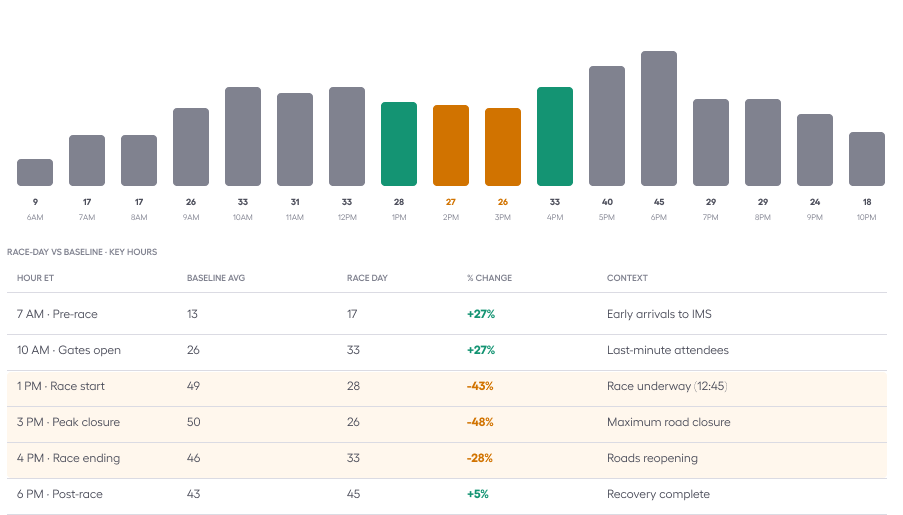
THE RACE TIMELINE IN TRAFFIC DATA
9-10 AM: Pre-race surge (+27%) · 12:45 PM: Race start, roads close · 1-3 PM: Maximum suppression (-48%) ·~3:45 PM: Race ends · 6 PM: Recovery complete (+5%).
Statistical Validation
Three-Tier Significance Summary
Statistical Detail

External Research Comparison

The data did not contradict the venue-surge hypothesis. It relocated the venue.
Insights & Recommendations
01 - VENUE ABSORPTION MODEL
Large motorsport events create traffic voids, not surges — in the host city
The net effect is city-wide traffic suppression during race hours. Fleet operators should expect significantly reduced demand in Indianapolis during 12-4 PM ET on race day.
02 - RACE WINDOW = DEAD ZONE
12:45-3:45 PM is unusable for Indianapolis fleet
Active rides drop up to -48% below baseline during the race. Schedule Indiana deliveries before 11 AM or after 5 PM on race day.
03 - POST-RACE OPPORTUNITY WINDOW
5-7 PM ET · rapid recovery, capture-able demand
By 6 PM ET, Indianapolis ride activity is back to baseline (+5%). Position near IMS exit routes (I-465,Georgetown Road) after ~3:45 PM to capture elevated demand.
Recommendations by Stakeholder
FLEET / LOGISTICS
Avoid scheduling deliveries between 10 AM and 5 PM ET on race day.
RIDESHARE / TAXI
Position at suburban staging during race, converge on IMS exits post-race.
INSURANCE / RISK
Race day Indiana = lower accident exposure for commercial fleets.
CITY PLANNERS / INDOT
Nexar data confirms effectiveness of race-day road management.
Limitations & Caveats
Limitations are first-class — not a footnote.
01 - Geographic Attribution
Cross-state race visitors from Ohio, Illinois, Michigan who started outsideIndiana are not captured in Indiana counts.
02 - Speedway Sample Size
Only 15-32 rides/day in Speedway. The +108.7% finding is directionally valid but should be read as a robust indicator, not calibrated.
03 - Memorial Day Confound
May 25 is both race day and Memorial Day Sunday. The two effects can not be fully disentangled from a single data point.
04 - Fleet Representation
Nexar captures dashcam-equipped vehicles — not all vehicles on Indiana roads. Bias may exist toward commercial fleets.
05 - External Sources
External benchmarks are based on FHWA guidance and general knowledge, not primary research retrieval.
06 - Race-Day-Only Scope
This study focuses on race day (May 25) only. The full 12-day venue period is a recommended follow-up.
Raw Data Tables
National Daily Totals
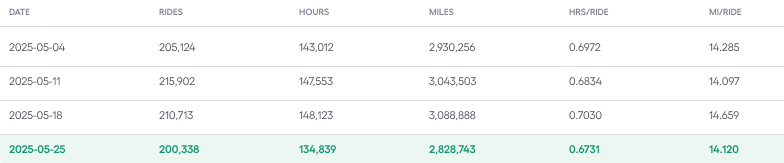
Indiana State Daily Totals
Indiana Vehicle Type · Race Day Breakdown
Want to dive deeper?
Nexar helps industry leaders turn vision into value. Dive into real-world success stories where our data redefined the road ahead - and see what it can do for you.