What happens to professional driving networks when America stops working? A full-week study of May 19-26, 2025 - bracketing the federal holiday on Monday, May 26 - measured against a four-week same-day-of-week baseline.
Executive Summary
CRITICAL CONTEXT - READ FIRST
The Nexar fleet is overwhelmingly commercial - taxis, rideshare, last-mile delivery, company vehicles, utility vans. Memorial Day is a peak consumer travel weekend (AAA: ~45M Americans by car), but commercial fleets predominantly park on federal holidays. This analysis measures the commercial side of the holiday - the collapse of professional driving - not the consumer surge. See Section 12 for the full reconciliation.
HOW TO READ THIS REPORT
Each numbered section is one page. The headline number on the cover (-22.9%) reappears as the spine of every section. Limitations (Section 14) and the raw appendix (Section 15) are first-class - not footnotes.
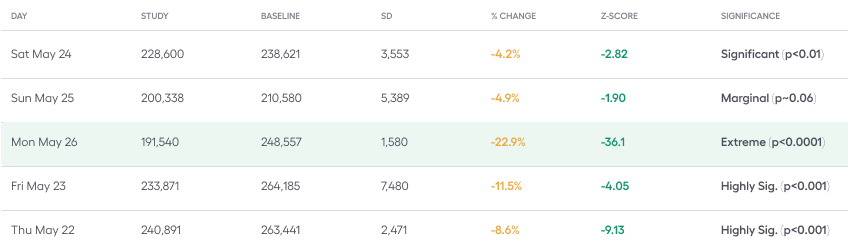
Memorial Day 2025 (Monday, May 26) produced the most dramatic traffic signal of the study period, with Nexar fleet activity dropping 22.9% below the baseline Monday average - from 248,557 rides to 191,540. The Memorial Day weekend also showed traffic reductions of 4.2% and 4.9% respectively.
🔑 Headline Finding
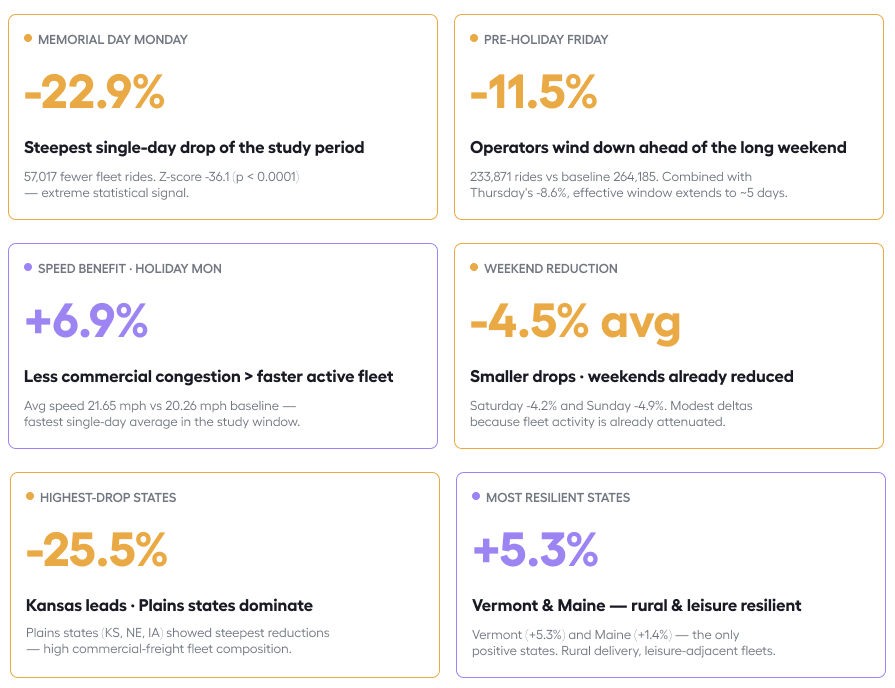
Memorial Day 2025 drove a −22.9% drop in US fleet traffic on the holiday Monday, accompanied by a +6.9% increase in average driving speed - reflecting significantly reduced road congestion as commercial vehicles park and leisure travelers take over the road network.

PRE-HOLIDAY RAMP-DOWN
The pre-holiday week showed a clear ramp-down: traffic was near-normal Monday through Wednesday but fell sharply Thursday (-8.6%) and Friday (-11.5%) as operators began winding down ahead of the long weekend. Vermont (+5.3%) and Maine (+1.4%) were the only states to post positive holiday-weekend deltas.
Background & Context
Memorial Day is observed on the last Monday of May in the United States, honoring military personnel who died inservice. In 2025, it fell on May 26. The holiday creates a three-day weekend (May 24-26) that is one of the highest-travel periods of the year for consumer leisure trips.
Historically, AAA reports 38-45 million Americans traveling by car over Memorial Day weekend - making it one of the top three busiest travel weekends annually. However, commercial and fleet traffic tells a very different story: trucks, taxis, and company vehicles predominantly reduce or cease operations on federal holidays.
Memorial Day is a peak consumer travel weekend. For the commercial fleet, it's the deepest single-day shutdown of the year.
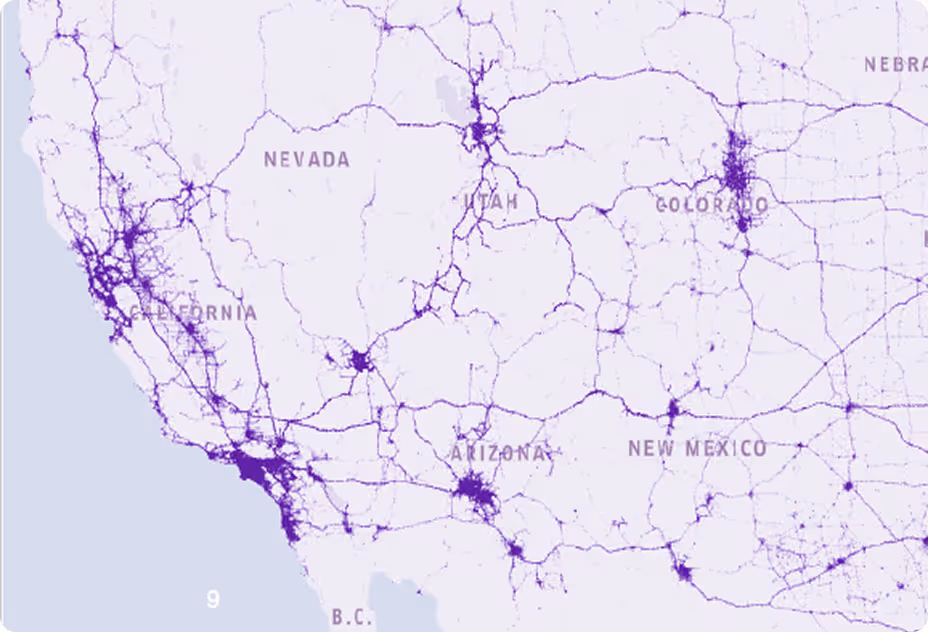
This analysis uses Nexar's network of fleet dashcam vehicles as a real-time sensor of commercial fleet activity across the United States.
What This Study Measures
The question this report answers is not "did Americans travel more?" - that is already known. The question is: by how much do US commercial fleets contract on a federal holiday - and where, and for how many days?
WHY MEMORIAL DAY MATTERS FOR FLEET ANALYSIS
Memorial Day produces an intentional, calendar-anchored perturbation in commercial fleet operations. Unlike weather-driven or demand-driven variation, this drop is structurally predictable - making it the ideal test case for fleet utilization models, route scheduling logic, and holiday-period planning.

Methodology
Data Source
Primary table:nexar-data-warehouse.Intermediate.IT_TRX_RIDE_LOCATIONS_CLASSIFIER, partitioned byride_start_date. All queries filtered tocountry = 'United States of America'.

Geographic Scope
National totals are decomposed into a state breakdown (by ride starting-point state) and a city breakdown across 24 major metropolitan areas with known Memorial Day traditions.
STATISTICAL APPROACH
Z-scores are computed as z = (study - u_baseline) / o_baseline with mean and SD drawn from the three same-day-of-week comparators. See Section 14 for power implications.
Key Findings
Six headline findings: three on volume, one on speed, one on geographic dispersion, one on resilience.
Day-by-Day Breakdown - Memorial Day Weekend
The three-day window: a moderate Saturday softening, a slightly deeper Sunday, and an extreme Monday collapse.

Memorial Day Monday - A Statistical Outlier
57,017 fewer rides than the baseline Monday average. With a Z-score of -36.1, this is an extreme statistical reduction by any standard - driven by federal holiday fleet shutdowns across commercial, logistics, and taxi/rideshare sectors.

Pre-Holiday Week Pattern (May 19–23)
The week leading into Memorial Day shows a characteristic ramp-down in fleet activity, particularly in the second half of the week:
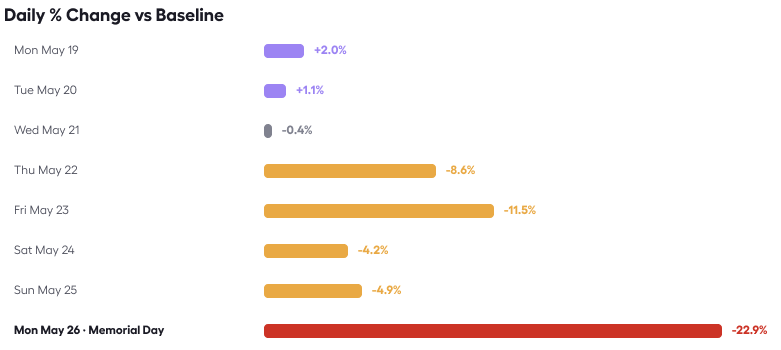
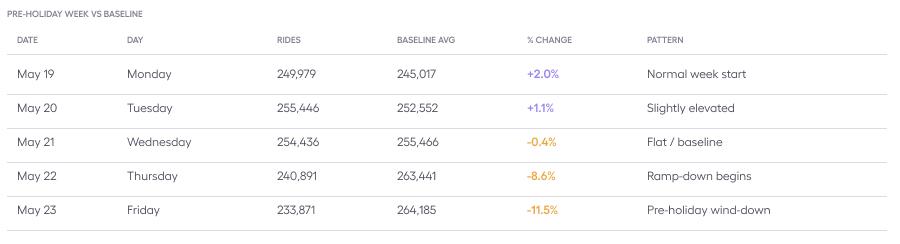
Ramp-Down Pattern Fleet activity was normal through Wednesday (±1%) but dropped significantly Thursday (−8.6%) and Friday (−11.5%) as fleet operators prepared for the long weekend. This suggests many commercial operators effectively begin their "holiday" on Thursday, creating a 5-day effective shutdown for portions of the fleet.
State-Level Analysis
Plains states lead contraction; New England leads resilience.
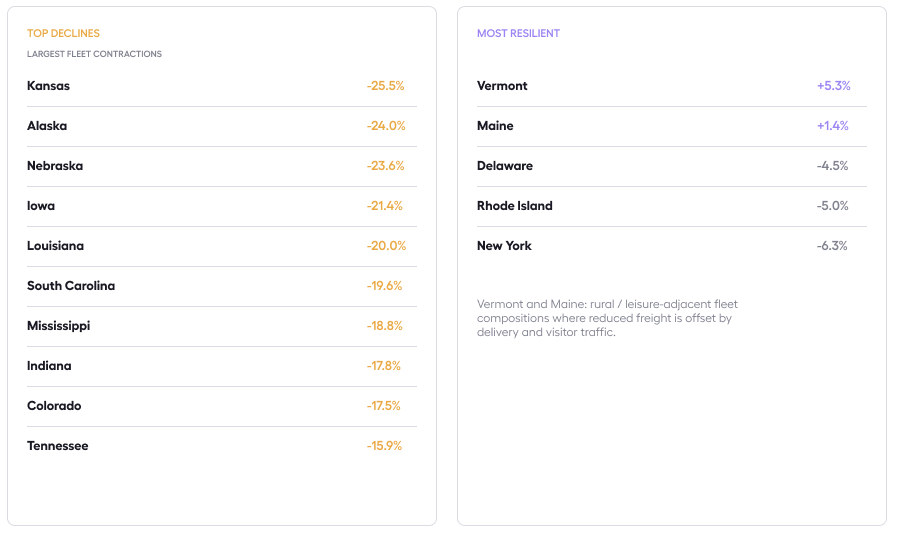
INDIANA - INDIANAPOLIS 500 WEEKEND
Indiana saw -17.8% fleet traffic drop despite the Indy 500 drawing 300,000+ spectators. The commercial side contracted significantly - event logistics were front-loaded prior to race day.
Major States Performance
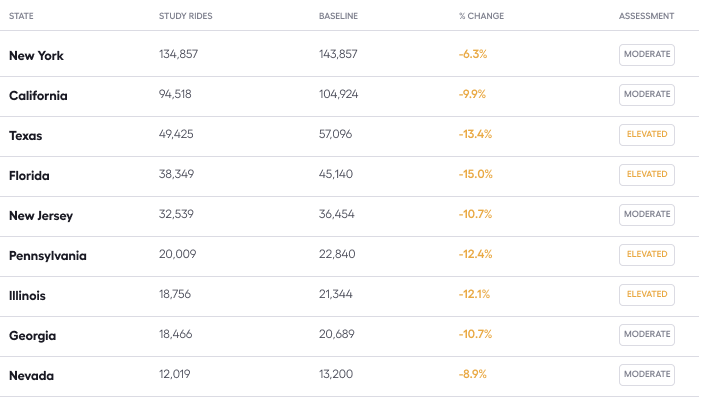
Geographic Pattern
The three largest-volume markets - NY, CA, TX - all moderate. Drops sharpen in mid-tier states with significant commercial freight share. The deepest-declining states are all Plains, Mountain, or Southern freight-heavy geographies. Where the fleet skews toward long-haul and agricultural freight, the holiday signal is sharpest.
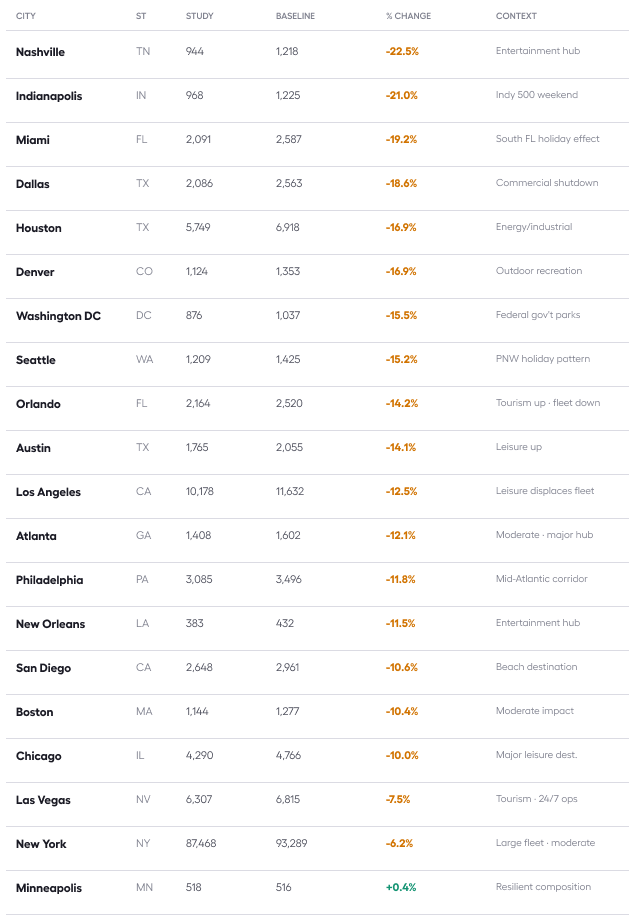
City-Level Analysis
Speed & Exposure Metrics
Daily Average Speed · MPH
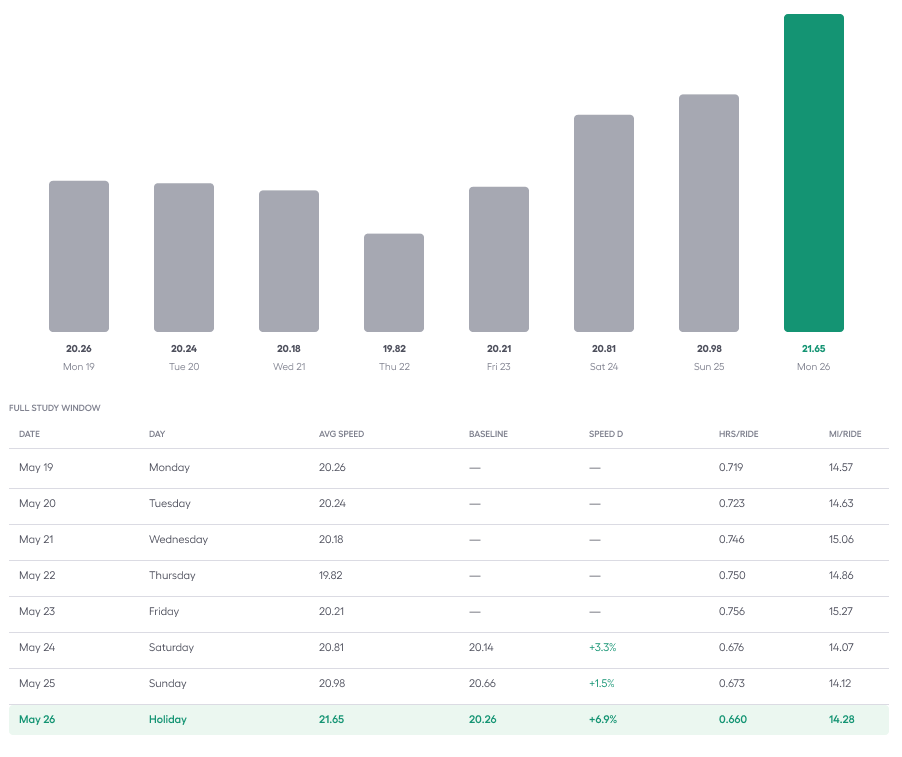
HOURS/RIDE
Hours-per-ride compressed on Memorial Day (0.660 vs 0.712 baseline) - shorter urban runs, not long-haul.
Statistical Validation
Interpreting the Z = -36.1
A Z-score of -36 lies far outside any reasonable noise envelope. The result is a structural reorganization of the fleet's operating state. The pre-holiday Thu and Fri drops (Z=-9.1 and Z=-4.1) confirm multi-day ramp-down.
External Benchmark Comparison
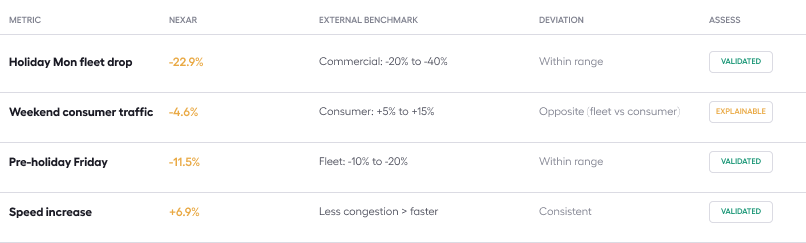
Triangulation
Three of four findings sit within published commercial-fleet range. The fourth - apparent contradiction with consumer traffic - is the expected outcome of measuring different populations. Nexar data completes the consumer narrative with the commercial counterpart.
Fleet Composition Context
NEXAR = FLEET SENSOR, NOT TOTAL TRAFFIC SENSOR
AAA reports ~45M Americans travel by car on Memorial Day - an increase. Nexar shows the opposite. Not acontradiction - it reflects Nexar's fleet composition.
- Nexar cameras are predominantly installed in commercial fleets: trucks, taxis, company vehicles, utility vans.
- Consumer personal vehicles - the leisure Memorial Day traveler - are largely not Nexar-equipped.
- Commercial fleets park on federal holidays; consumer vehicles flood the highways.
- Result: Nexar data captures the commercial traffic collapse while AAA measures the consumer surge.
This dual reality is what makes Memorial Day uniquely interesting: the roads have more total vehicles (consumer leisure) but far fewer commercial vehicles. The combination produces faster speeds for the remaining fleet.
Conclusions & Recommendations
01 - MAJOR FLEET SHUTDOWN SIGNAL
Memorial Day = deepest single-day fleet drop
A -22.9% drop is statistically ironclad (Z = -36.1). Fleet managers should build this into route scheduling.
02 - RAMP-DOWN BEGINS THURSDAY
Treat as a 4-5 day reduced-capacity window
Thursday (-8.6%) and Friday (-11.5%) reveal the effective holiday period starts 3-4 days before.
03 - SPEED BENEFIT FOR ACTIVE FLEET
Holiday operation = less congestion
Vehicles on the road experience +6.9% faster speeds. Last-mile delivery may find holiday ops advantageous.
04 - GEOGRAPHIC VARIATION IS SIGNIFICANT
Plains states drop deepest · coastal resilient
Plains states show -21% to -26% drops. Fleet operators should model regional effects separately.
05 - KEY CITY INSIGHT
Miami & Dallas lead · NYC & Vegas hold steady
Miami (-19.2%) and Dallas (-18.6%) steepest; NY (-6.2%) and Vegas (-7.5%) resilient.
Limitations
ABOUT THIS SECTION
Limitations are first-class — not a footnote. They define the scope within which findings should be interpreted.
01 - Fleet Composition Bias
Nexar data captures commercial / fleet vehicles, not the total vehicle population. Consumer leisure traffic is not directly observed by this dataset.
02 - Geographic Representation
Nexar density varies by state. Small-state findings (VT, ND, WY) are based on smaller sample sizes and should be interpreted with caution.
03 - Baseline Period
Only 3 comparable weeks are available per day-of-week. Extended baselines would improve Z-score precision and reduce variance estimation error.
04 - Starting-Point Geography
State and city assignment is based on the ride's starting location, not destination.Long-haul trips are attributed to the origin state.
05 - Year-over-Year Comparison
This analysis uses 2025 data only; year-over-year trends require 2024 comparison data which is outside the study scope.
Raw Data Tables
Full Study Period · Daily Data

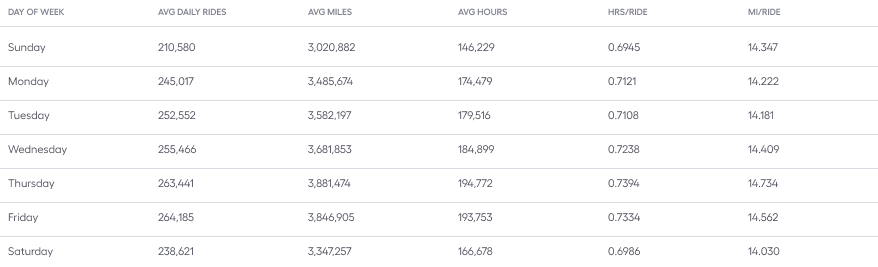
Baseline Summary · 4-Week Average by Day-of-Week
Want to dive deeper?
Nexar helps industry leaders turn vision into value. Dive into real-world success stories where our data redefined the road ahead - and see what it can do for you.