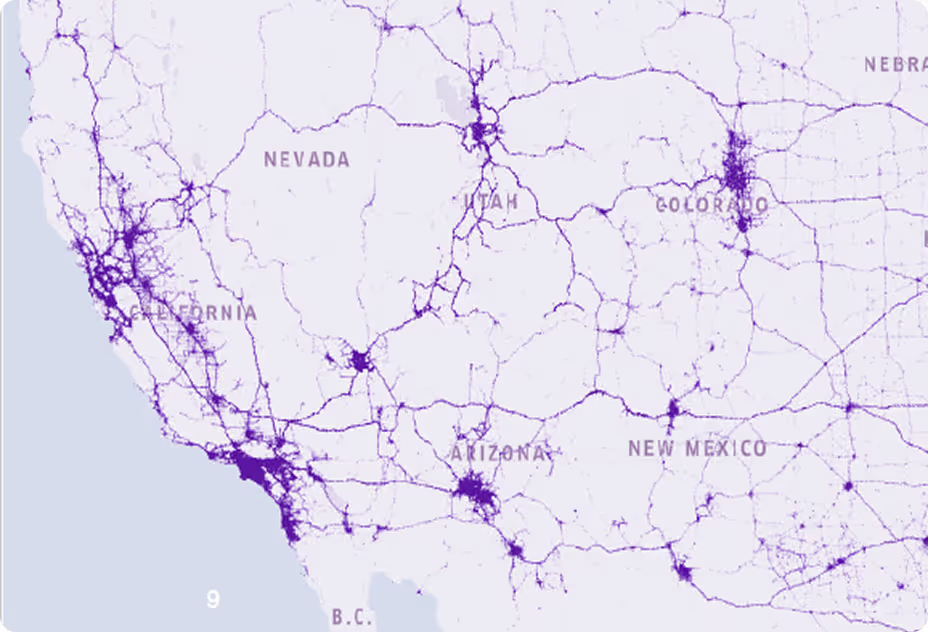
Nexar telematics data shows a +79.7% rise in IMU-detected collision rate year over year — coexisting with an all-time record low in NYC traffic fatalities.
Executive Summary
▲ CRITICAL CONTEXT — READ FIRST
The +79.7% collision-rate increase is statistically ironclad — but it does not mean NYC roads are broadly more dangerous. Nexar's IMU-detected events and NYC DOT fatality data measure fundamentally different things: low-speed fender benders vs fatal high-speed crashes. Both moved in 2025 — in opposite directions.
Reading either metric in isolation will mislead you. NYC fatalities hit an all-time low (205 deaths, −19% vs 2024) in the same window where Nexar's collision rate nearly doubled. Both are correct. Section 07 reconciles them.
● THE APRIL CONVERGENCE: The single most important finding is at the tail of the study: April 2026 (356.1/M) is statistically indistinguishable from April 2025 (359.4/M) — a −0.9% YoY change. The aggregate +79.7% headline masks a dramatic decelerating arc. May 2026 data will confirm or break the trend reversal hypothesis.
This study compares Nexar telematics for New York City across two identical four-month windows: Jan 1 – Apr 30, 2025 and Jan 1 – Apr 30, 2026. The headline is a +79.7% increase in the collision rate per million rides — from 234.4 to 421.2 — statistically unambiguous (Z = 13.77, p < 0.0001) and largely explainable by the structural disruption of NYC's Congestion Pricing Zone, which went live in January 2025.
Headline Finding
The collision rate increase is real, statistically ironclad, and explainable — but it does not mean NYC roads are more dangerous overall. Rising Nexar IMU collision events coexist with all-time record-low NYC traffic fatalities in 2025. Congestion pricing is the unifying structural driver across nearly all findings.
Headline Metrics

◆ THE APPARENT PARADOX — MORE COLLISIONS, FEWER DEATHS: Nexar's IMU detects vehicle impacts above a G-force threshold — including fender-benders in congested traffic that are never reported to NYPD. NYC DOT counts traffic fatalities. Congestion pricing produces more low-speed impacts (compressed traffic, high intersection density) while simultaneously producing fewer fatal high-speed crashes. Both datasets can be — and are — correct.
Key Metrics · Full Period Comparison
Seven metrics, two periods, one analytical question. The collision rate moves sharply. Hard brakes stay flat. Harsh acceleration drops. The divergence is the story.

Three Behavioral Counter-Indicators
Collision Rate: +79.7%
187 additional collisions per M rides. 234.4 → 421.2 per million. The single most significant year-over-year change in the dataset.
Hard Brakes: ~0%
29,855 → 29,848 / M rides. Statistically flat. Braking is reactive — drivers don't suppress it voluntarily to protect their licenses.
Harsh Acceleration: −24.9%
1,556 → 1,168 / M rides. License-protection signal — the Feb 2026 penalty law produced a sharp, sustained drop in voluntary aggressive driving.

Monthly Collision Rate Trend
The aggregate +79.7% masks an arc: a severe winter peak then sustained deceleration through spring, culminating in April 2026 reaching parity with April 2025.
Collision Rate per Million Rides Monthly
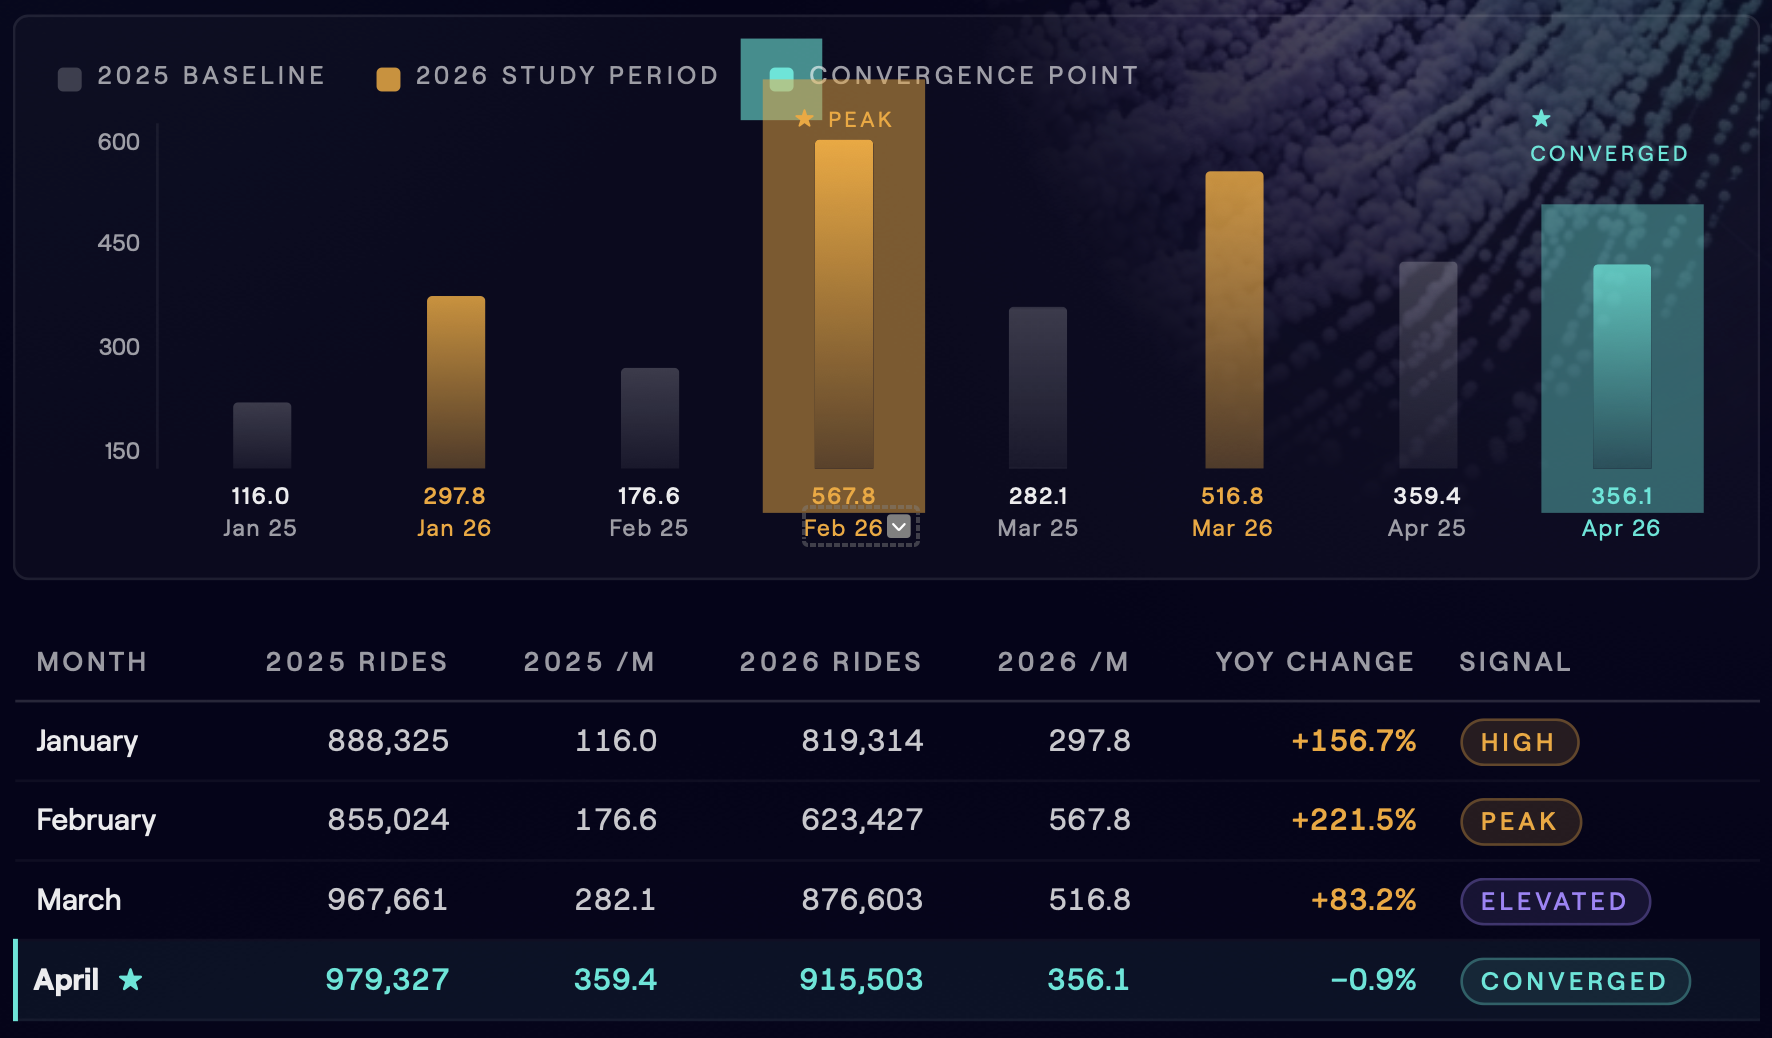
● APRIL CONVERGENCE · THE MOST IMPORTANT FINDING: April 2026 (356.1/M) is statistically indistinguishable from April 2025 (359.4/M) — the first month with no measurable year-over-year deterioration. This may signal the start of a trend reversal as drivers, dispatchers, and city infrastructure adapt to post-CRZ conditions. May 2026 data will be critical for confirmation.
School Hours & Time-Window Analysis
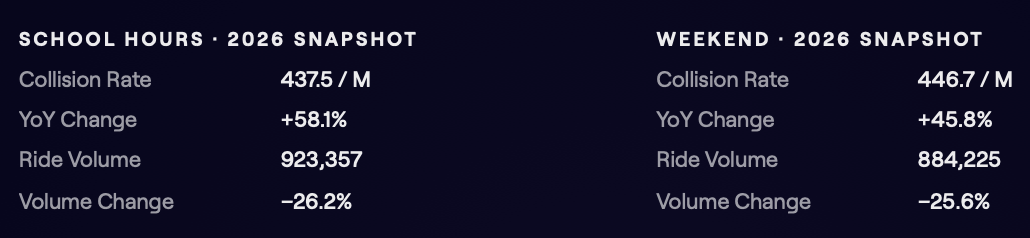
Collision rate increases are present across all time windows — school hours, off-peak weekday, and weekends — indicating a broad structural shift rather than a time-specific driver. Weekends show the smallest relative increase (+45.8%), consistent with CRZ selectively reducing leisure trips.

Two Notable Time-Window Findings
School Hours · Novel (437.5/M)
School hours rank just below weekends in 2026 absolute rate (437.5 vs 446.7), a notable shift from 2025 (276.7 vs 306.3). This pattern is novel — warrants a spatial follow-up cross-referencing school zone camera locations.
Weekend Suppression · Smallest Relative Increase (+45.8%)
Weekends show the smallest relative YoY rise despite the highest absolute rate. Consistent with congestion pricing selectively reducing discretionary/leisure vehicle trips while professional FHV operators (who drive more weekdays) continue operating.
Day-of-Week Pattern
All seven days show elevated 2026 collision rates. Saturday remains the most dangerous in absolute terms (461.8/M). Wednesday and Saturday show the smallest relative increases; Tuesday and Friday the largest.
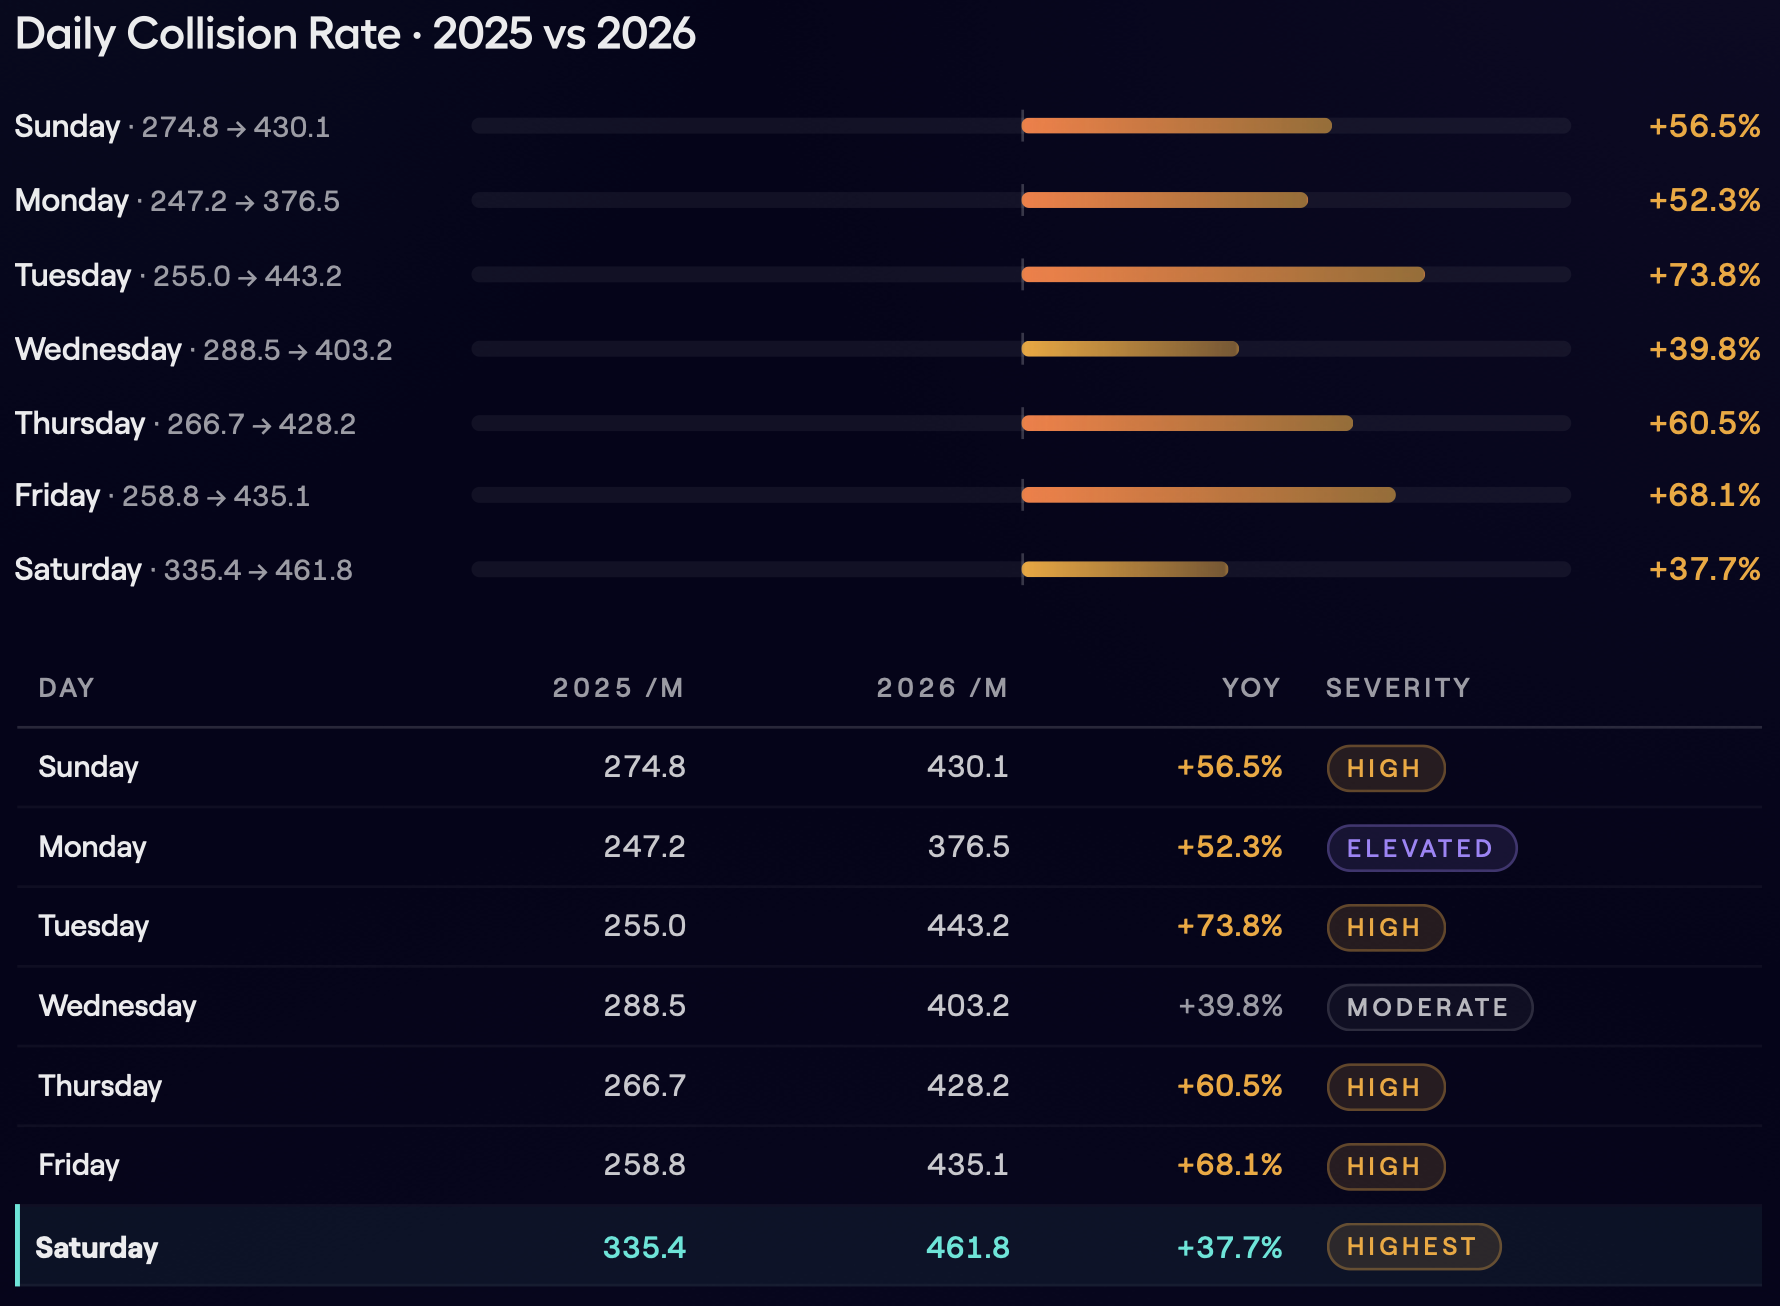
◆ WEDNESDAY + SATURDAY · THE TWO SMALLEST INCREASES: Wednesday (+39.8%) and Saturday (+37.7%) are the two days with the smallest YoY increases. Wednesday's mid-week stability may reflect more experienced commuter patterns. Saturday's lower relative increase despite the highest absolute rate is consistent with congestion pricing's selective suppression of leisure trips — the Saturday fleet in 2026 skews toward professional operators who handle risk better.
Congestion Pricing · The Unifying Driver
Of every external variable considered, the Central Business District Tolling Program (CBDT) — NYC's Congestion Pricing Zone, launched January 2025 — is the single most important. It explains the ride volume decline, the fleet composition change, the collision rate increase, and partially the weekend suppression effect.

Compressed traffic, fewer fatal high-speed crashes, more low-speed collision in tighter quarters.
Why CRZ Explains So Much of the Signal
• Ride volume decline (−12.8%) — Some operators left the Nexar-equipped fleet as short CRZ trips became uneconomic.
• Fleet composition change — Short FHV trips into CRZ down 9–35%; remaining fleet skews toward longer, professional operators.
• Collision rate rise (+79.7%) — Compressed traffic, higher intersection density, more low-speed collisions.
• Weekend suppression — CRZ selectively reduces discretionary trips, sparing professional operators who drive carefully.
• Fatality decline (−40% in CRZ) — Same compression removes the high-speed environment for fatal crashes.
The Apparent Paradox · DOT vs Nexar
NYC recorded 205 traffic deaths in 2025 — an all-time record low, −19% vs 2024. Q1 2026 showed 42 deaths, −7% YoY. This directly contradicts any reading of "NYC roads became more dangerous." Both Nexar and DOT are correct.
▲ Two Datasets · One Truth · Different Phenomena Nexar's IMU detects vehicle impacts above a G-force threshold — including minor fender-benders in congested traffic that are never reported to NYPD. DOT counts fatalities and NYPD-reported injury accidents. Congestion pricing produces more low-speed impacts (high volume density, frequent stops) and fewer fatal high-speed crashes. Both datasets are correct simultaneously.
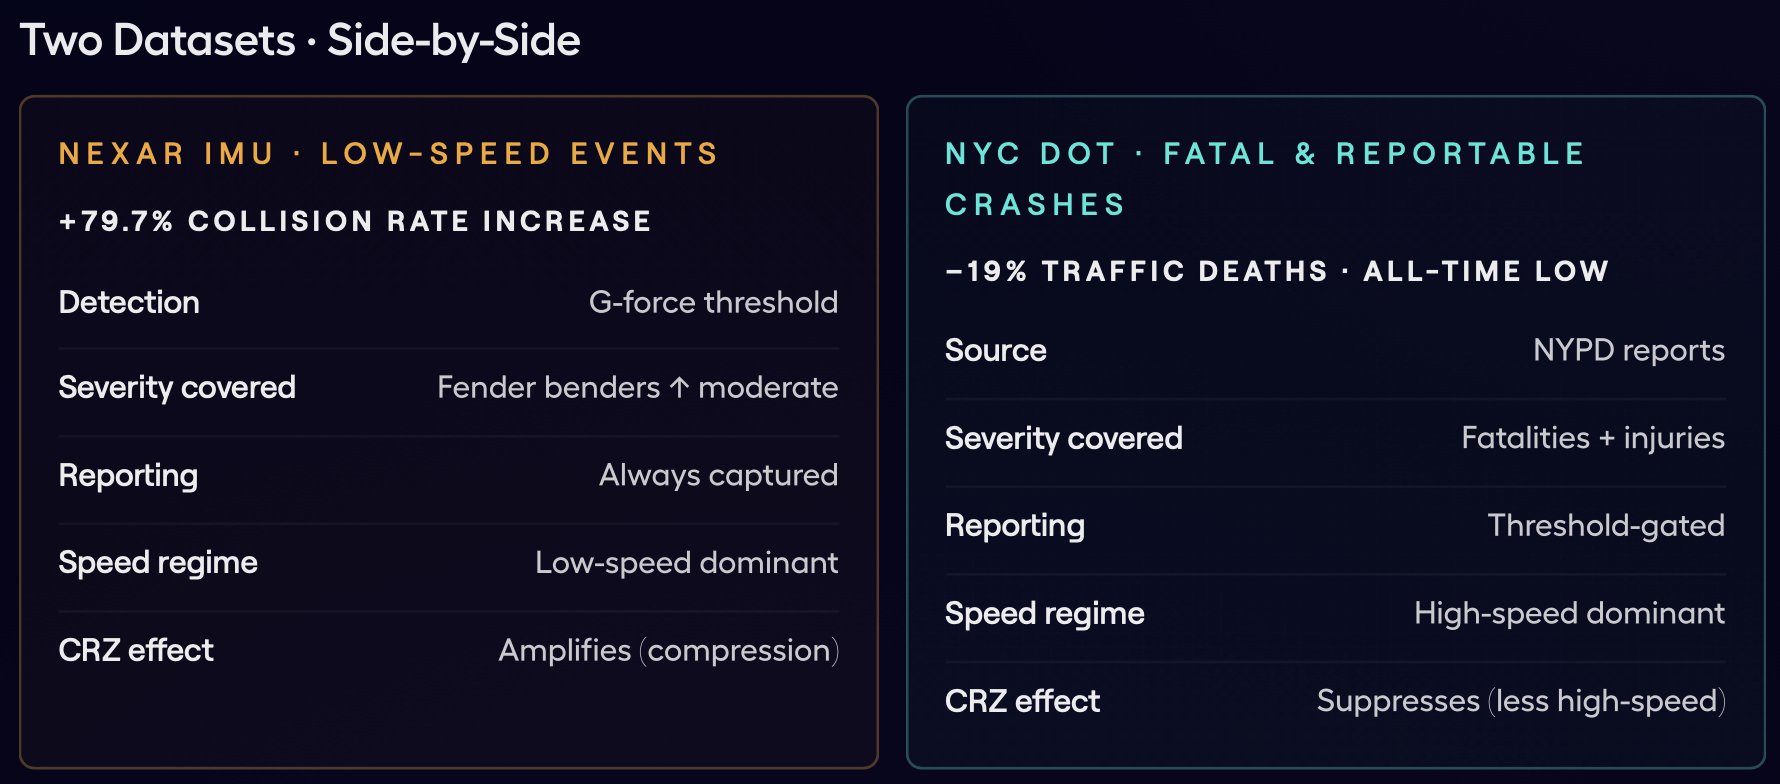
NYC TRAFFIC DEATHS · 2025: 205 — The lowest annual figure on record, and −19% vs 2024. Q1 2026 continued the trend at 42 deaths (−7% YoY). The "more collisions" headline and the "fewer deaths" headline both reflect reality. Reading either without the other is wrong.
Other Policy & External Drivers
Three additional external variables shape the dataset. Each is a credible partial driver — none rivals CRZ in explanatory power.

● HIERARCHY OF EXPLANATORY POWER: CRZ >> Penalty Law > Weather > FHV Market > School Cameras. CRZ explains a majority of the structural increase. The penalty law explains the behavioral metric (harsh acceleration). Weather is a candidate for the February spike specifically. FHV market growth and school cameras were constants in the window — they shape context, not the differential.
Statistical Significance
The +79.7% collision rate change is the strongest single statistical result in any recent Nexar study. The 95% confidence intervals are completely non-overlapping. The signal is not noise.
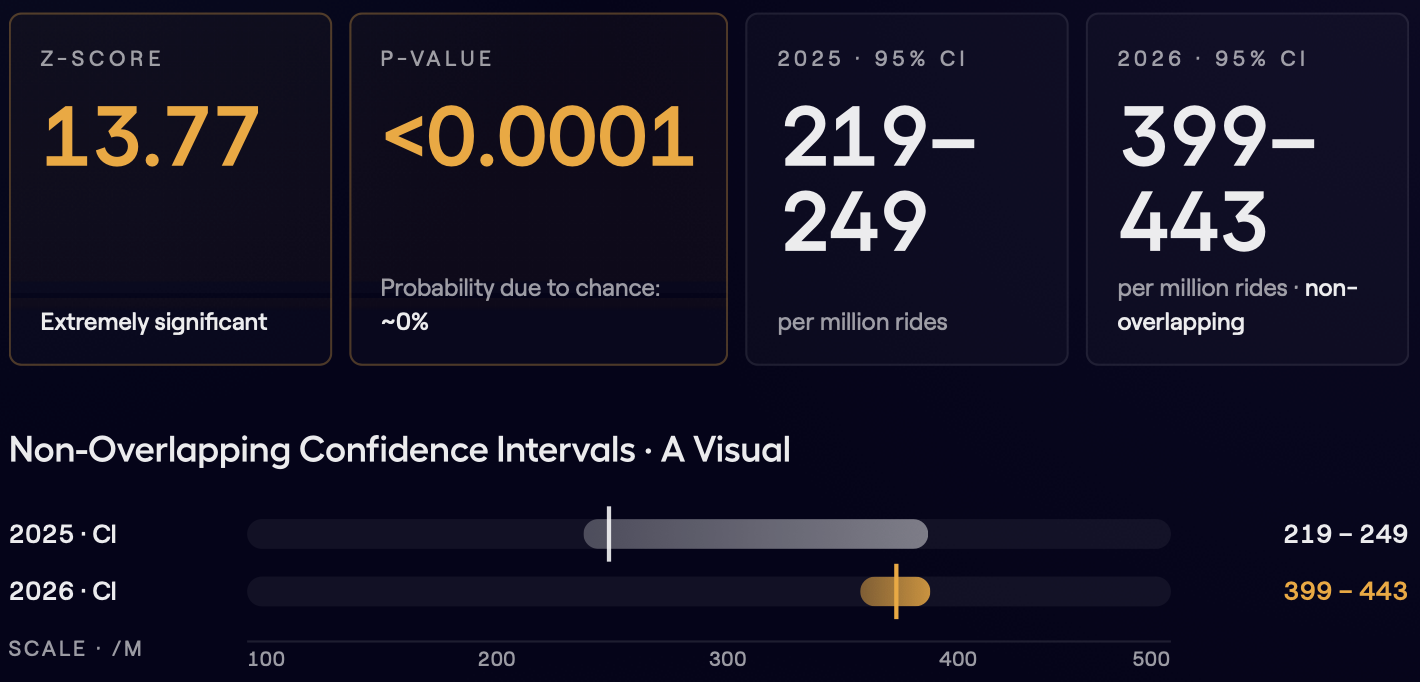
● WHAT THIS MEANS FOR INTERPRETATION: The 95% intervals are completely non-overlapping — there is no plausible scenario under random sampling where the two rates are equal. The Z-score of 13.77 is far beyond the conventional 2.58 threshold for 99% confidence. The change is real. The analytical question is therefore not "did the rate change?" but "why did it change?" — and the answer is primarily structural (CRZ, fleet composition), not behavioral deterioration.
Methodology
Data Source
All metrics are derived from IT_TRX_RIDE_LOCATIONS_CLASSIFIER, Nexar's internal telematics table partitioned by ride_start_date. The table contains ride-level records including trip metrics and collision event flags for Nexar-equipped vehicles.
Geography Filter
New York City rides were identified using state = 'New York' with city-name variants covering the five boroughs, including English and Cyrillic encodings (4 multilingual variants used). A small fringe of rides with non-standard city encoding may be excluded — discussed in Section 12 (Limitations).
Collision Rate Calculation
▲ CORRECTION NOTICE: This analysis corrects issue #48, which incorrectly compared January–April 2024 vs January–April 2025. The current analysis uses the correct comparison window: January–April 2025 (baseline) vs January–April 2026 (study period). All findings supersede prior publication.
Recommendations · Next Steps
Five actions, ranked by analytical priority. R1 is the single most actionable next step.
01 HIGHEST PRIORITY · MONITOR MAY–JUNE: Confirm or refute the April convergence
If May 2026 continues at ~April 2026 levels (~356/M), a trend reversal is confirmed and the elevated Jan–Mar 2026 window can be classified as a transient disruption phase rather than a new baseline. This is the single most actionable next step.
02 INVESTIGATE FLEET COMPOSITION: The −12.8% ride decline is unexplained by TLC market data
TLC market grew +2.6% YoY while Nexar rides fell 12.8%. Identify which operators left the Nexar network between 2025 and 2026. If the departing fleet was systematically different (newer vehicles with fewer collision flags), the per-ride collision rate change is partially a selection artifact.
03 SCHOOL ZONE SPATIAL DEEP-DIVE: +58.1% with no external corroboration
A spatial analysis cross-referencing Nexar ride segments against NYC DOT school zone boundaries would determine whether school-proximate roads are driving the school-hours elevation — or whether it is a general time-of-day effect surfacing during the school window.
04 WEATHER ATTRIBUTION · FEBRUARY: Separate snow from penalty-law adjustment
February 2026 peaked at 567.8/M (+221.5%). Adding NOAA snowfall/precipitation data for Feb 2026 vs Feb 2025 would separate weather contribution from policy-change contribution. If snowier, weather explains; if not, the penalty law adjustment period was the driver.
05 CRZ ZONE SEGMENTATION: Isolate the congestion-pricing effect precisely
Split the analysis into rides that enter the Manhattan CRZ vs rides that remain outside it. This would isolate the congestion pricing effect precisely and provide Nexar a cleanly attributable metric to share with NYC DOT as evidence of CRZ behavioral impact.
Limitations & Caveats
▲ About This Section Limitations are presented as a first-class section — not a footnote. These define the scope within which the +79.7% headline should be interpreted.
L1 · Collision definition mismatch
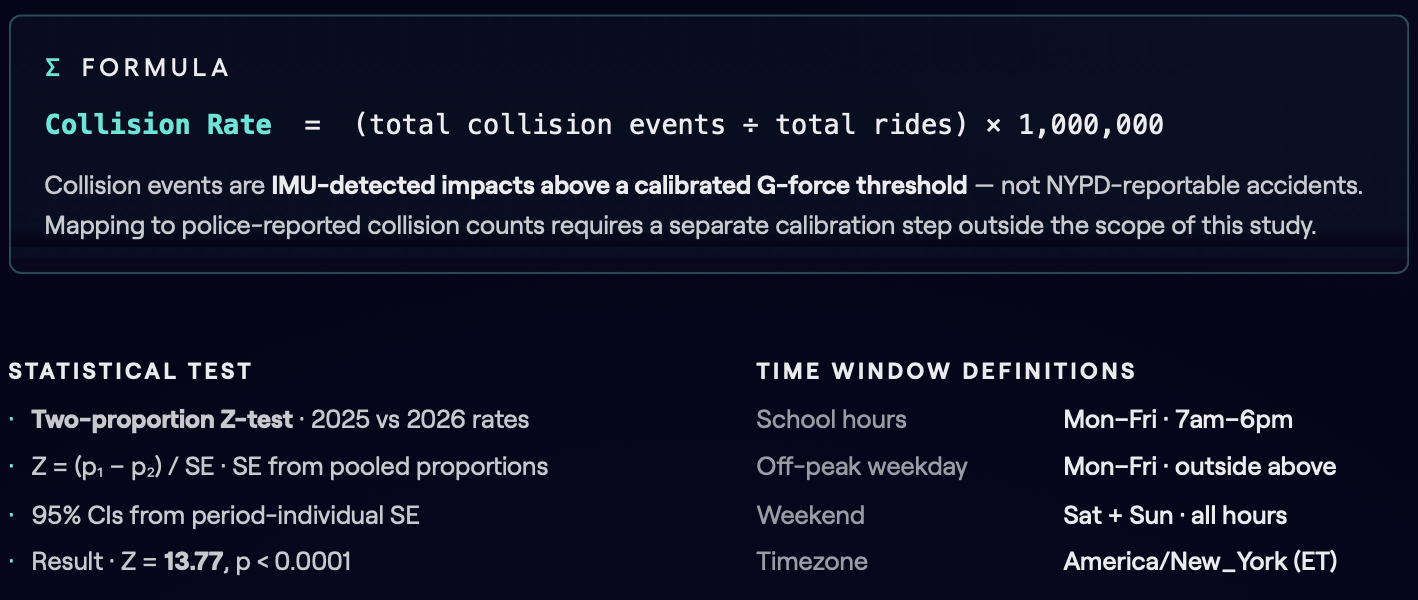
Nexar IMU-detected events ≠ NYPD-reportable accidents ≠ traffic fatalities. These are not directly comparable to any city-wide safety statistics. Nexar collisions include minor impacts invisible to NYPD reporting thresholds.
L2 · May 2026 excluded
No May 2026 data was available at time of analysis. The comparison uses four complete months only. May 2026 data would be the critical test of whether the April convergence holds — see Recommendation R1.
L3 · Fleet composition confound
The −12.8% ride volume decline may reflect fleet turnover, not demand. If the surviving 2026 fleet is systematically different from the 2025 fleet, per-ride metrics may be biased. This cannot be resolved without operator-level data — see R2.
L4 · Monthly count gap (~60,000 rides)
A ~60K-ride gap exists between the aggregate total (3,750,716 in 2025) and the sum of monthly counts (3,690,337), due to a Cyrillic city-name variant present in the full-period query but excluded from the monthly breakdown. Rates within each query are self-consistent; the gap does not affect findings.
L5 · Geography encoding
NYC filter uses 4 multilingual city-name variants. A small fringe of rides with non-standard or missing city encoding may be excluded from both periods consistently — making this a stable bias rather than a differential one.
Appendix · Data Sources

Want to dive deeper?
Nexar helps industry leaders turn vision into value. Dive into real-world success stories where our data redefined the road ahead - and see what it can do for you.